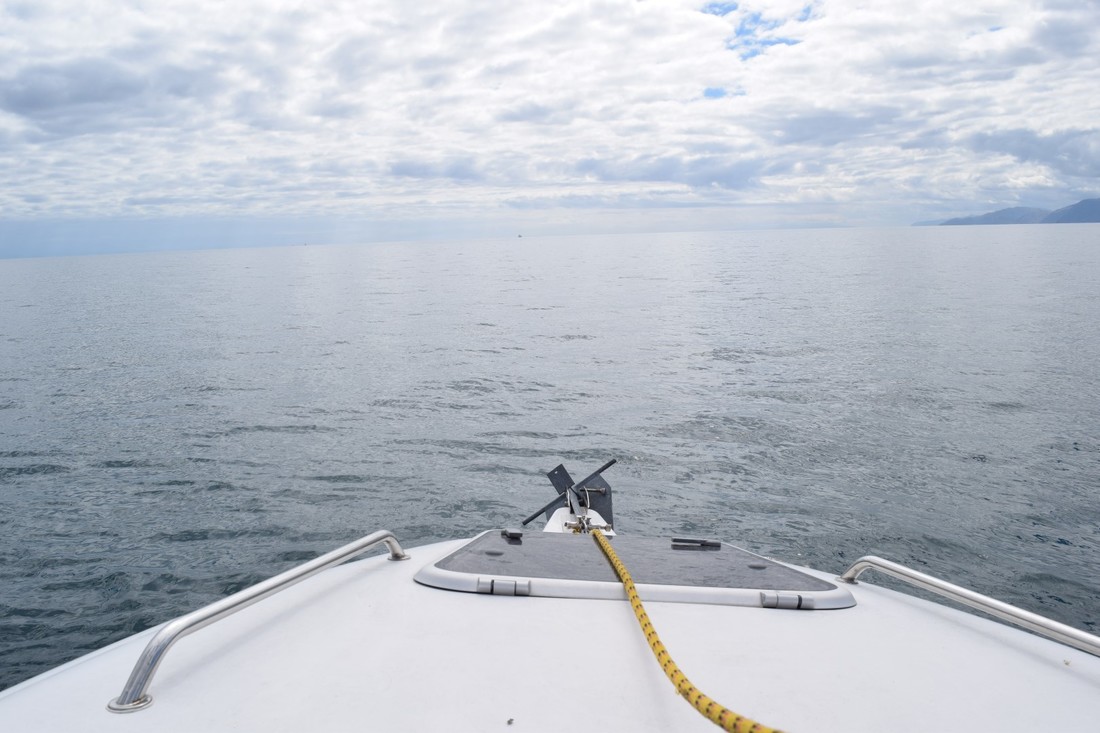
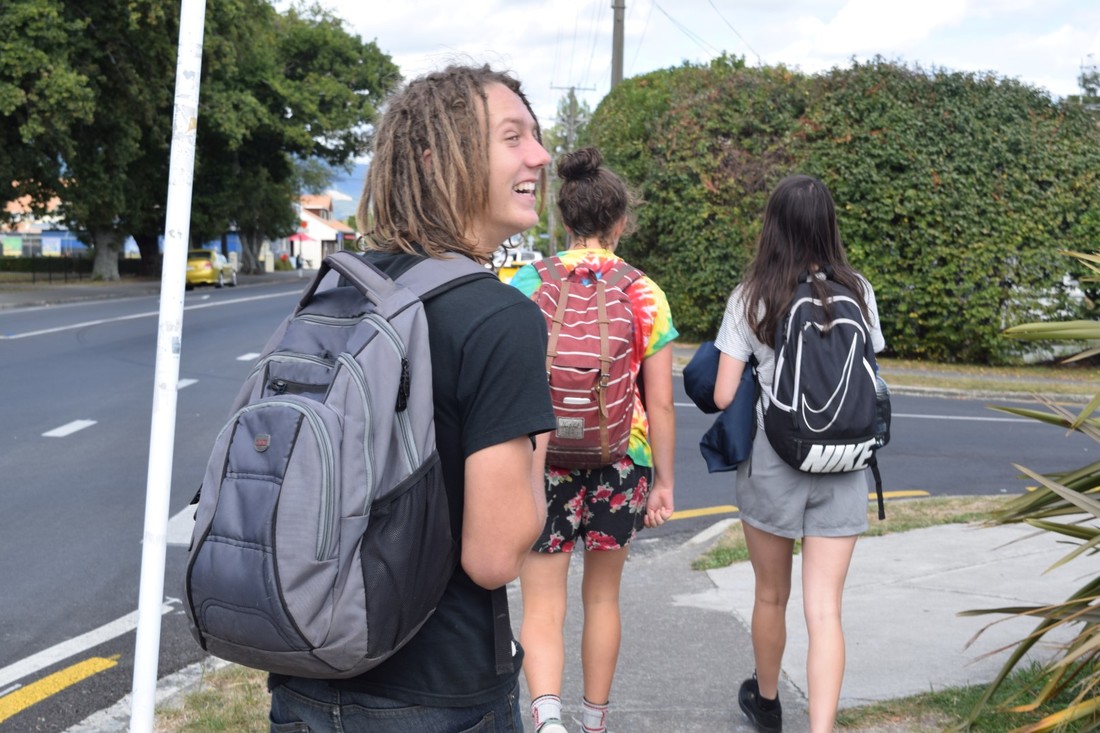
All sorts of trip photos and stuff
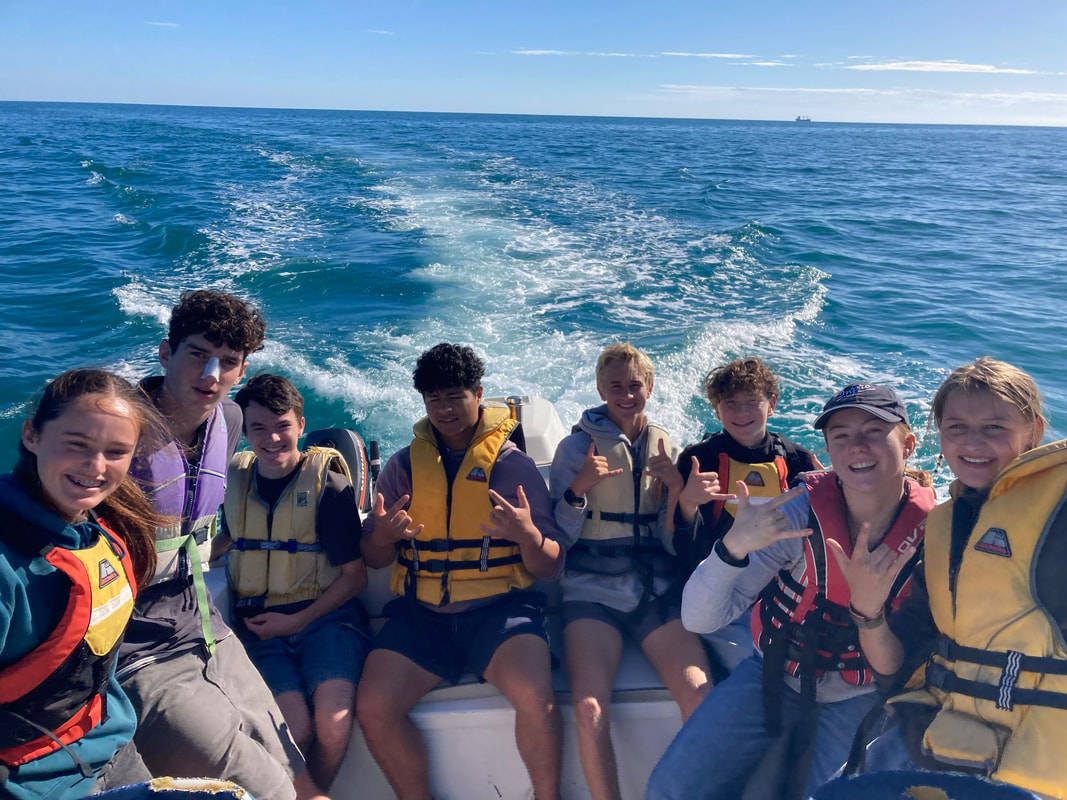
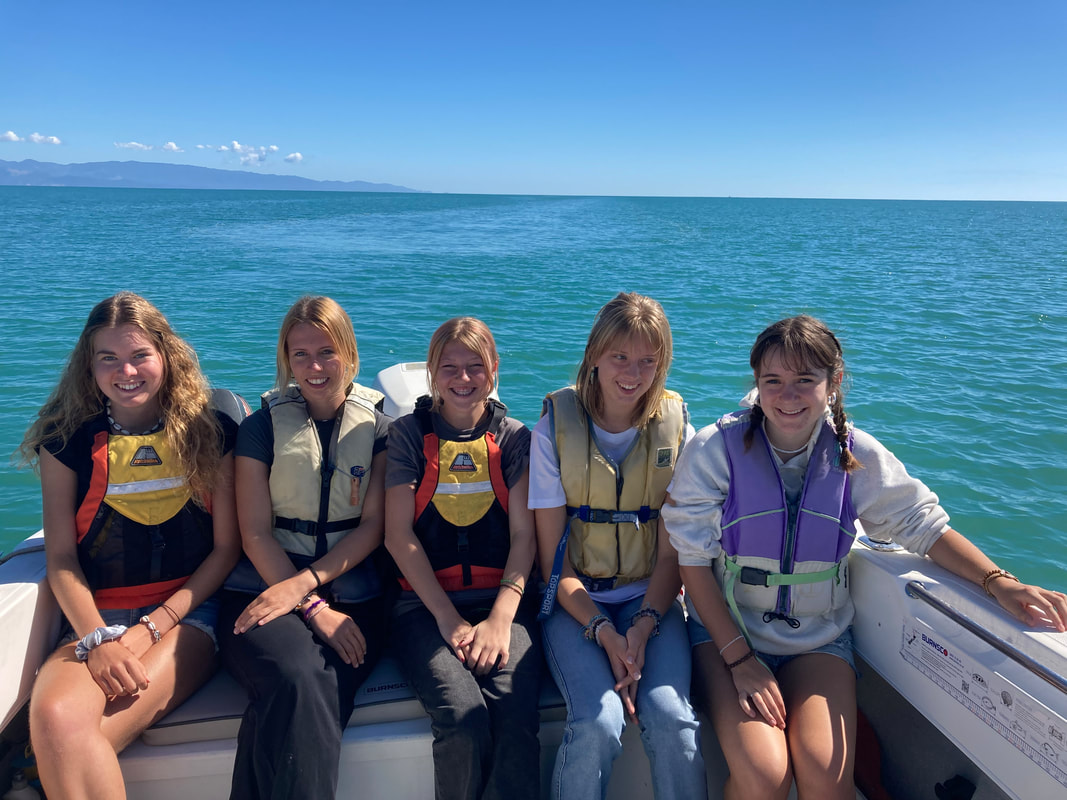
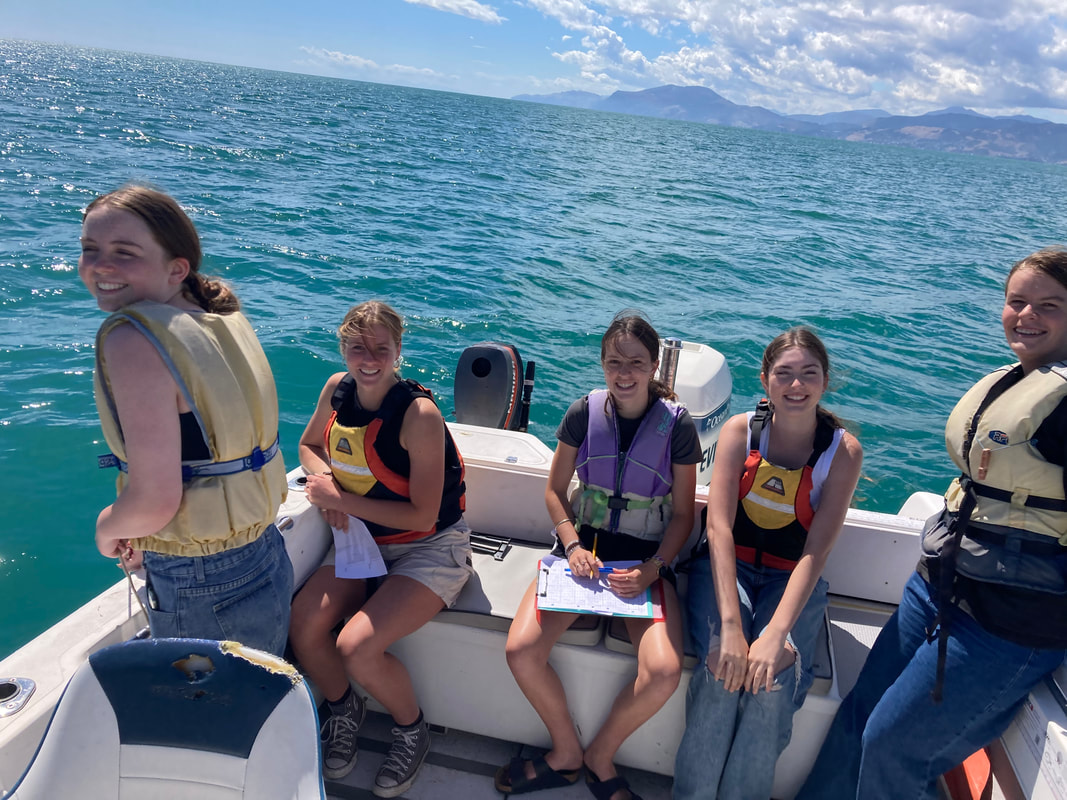
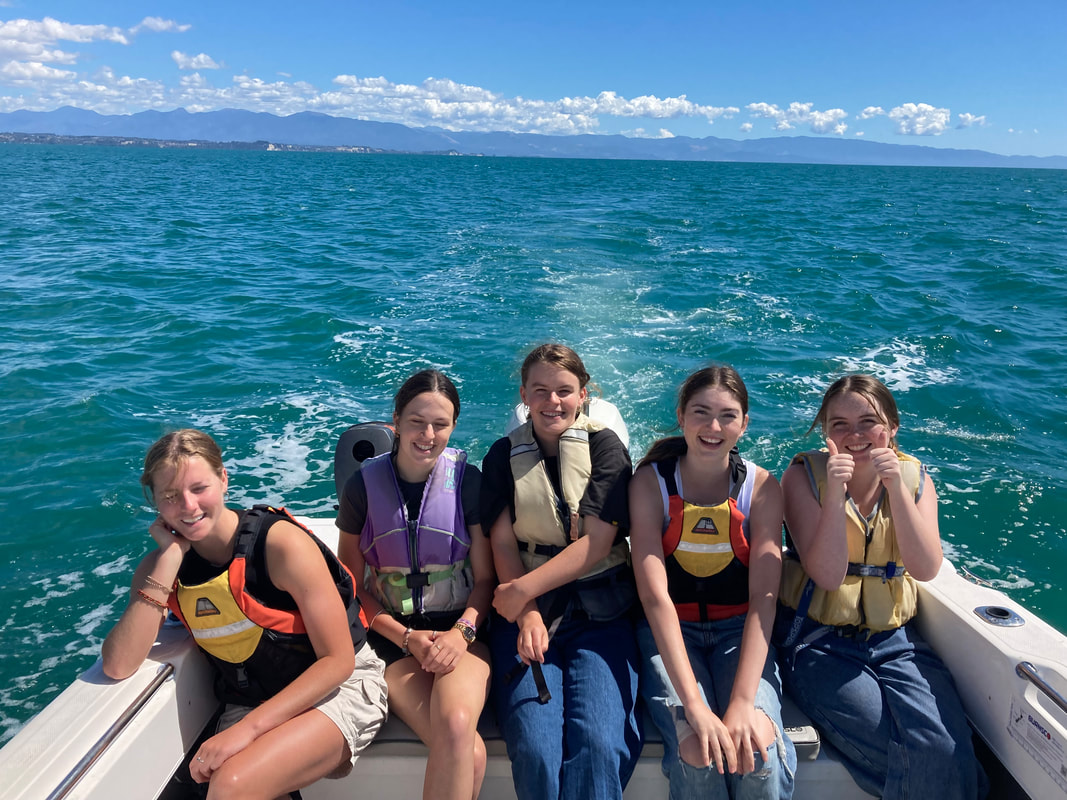
Feb 27 & 28, 2024
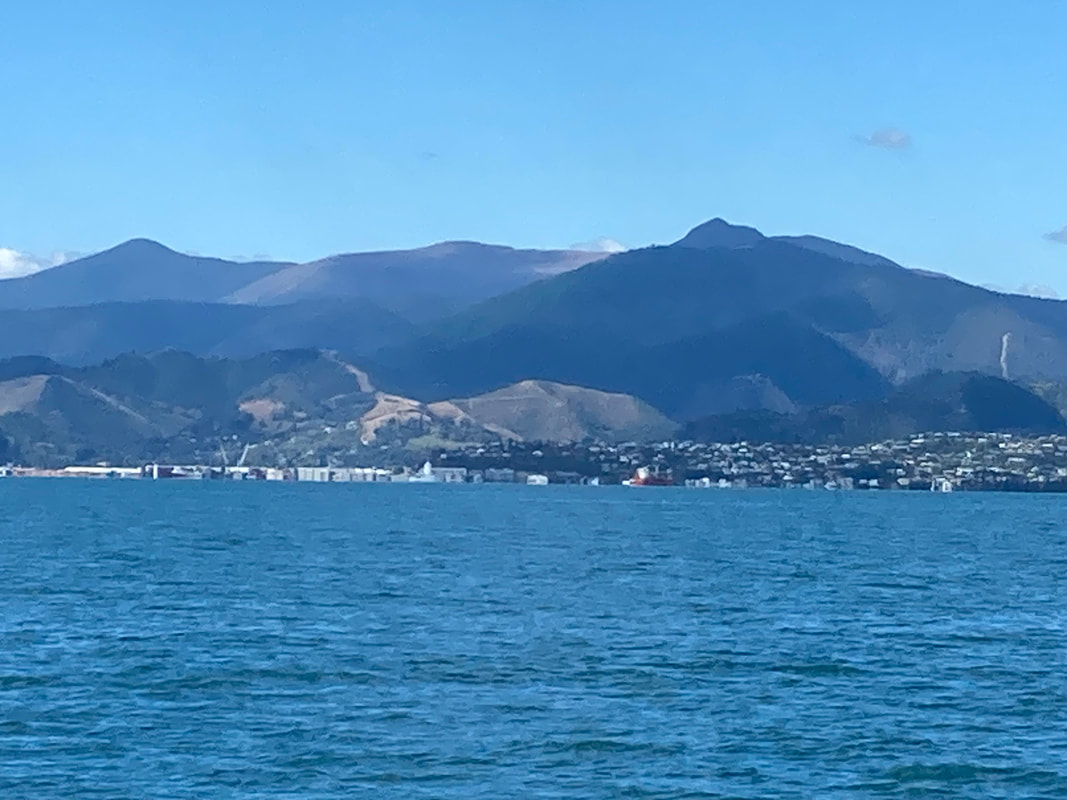
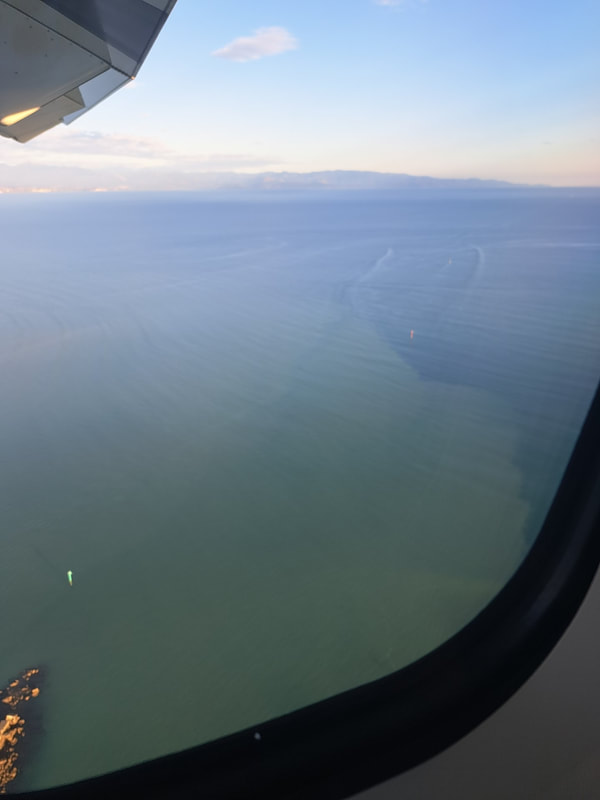
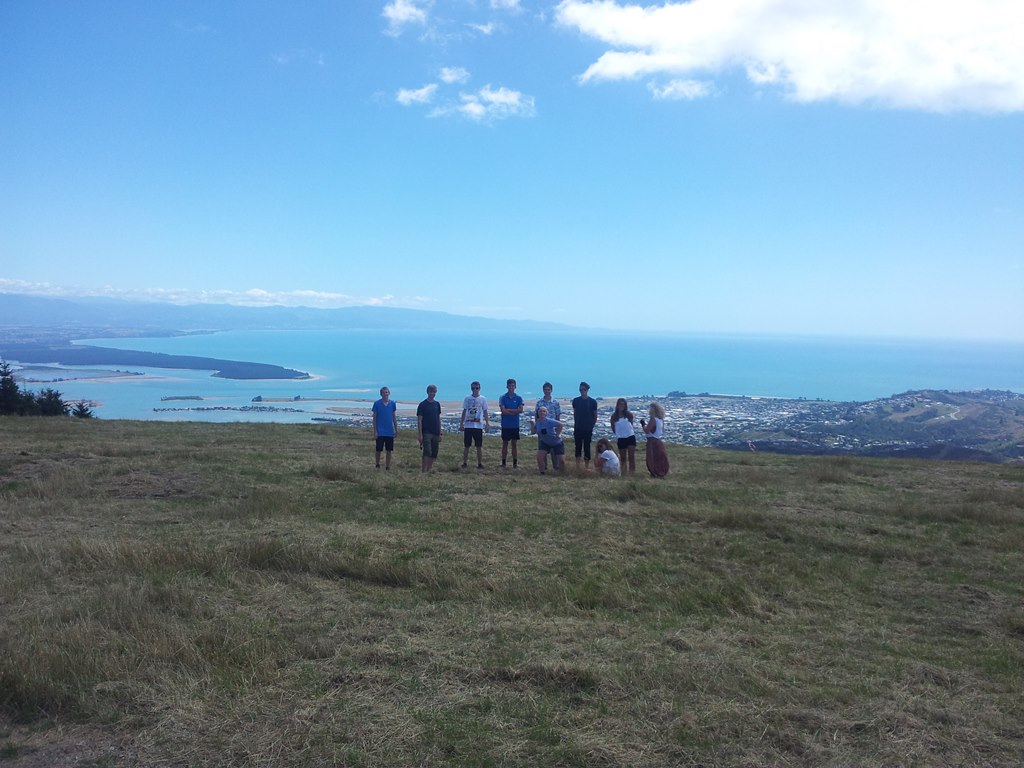
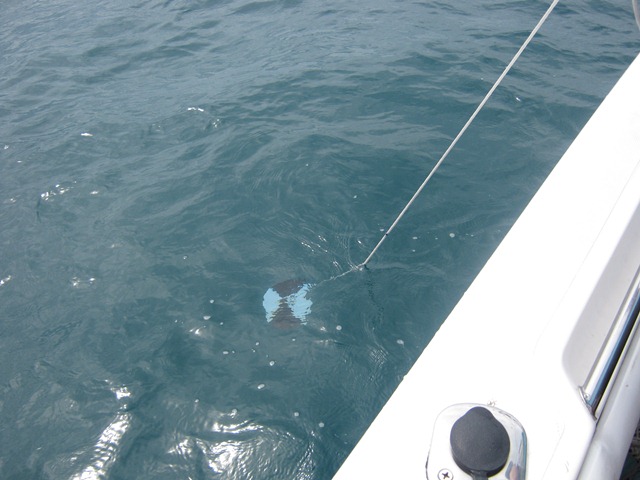
We can also do some 'ground truthing' thanks to Debbie flying back (from partying in Auckland) before school on the second day of our data gathering.... look for the image from the plane
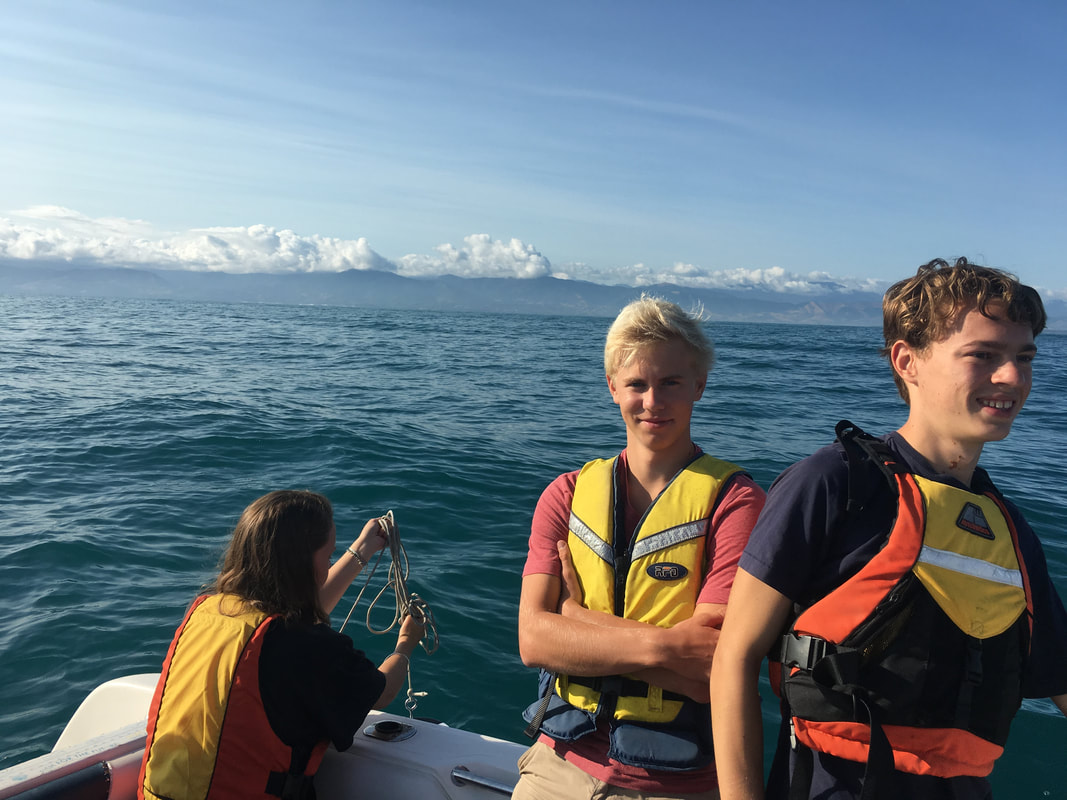
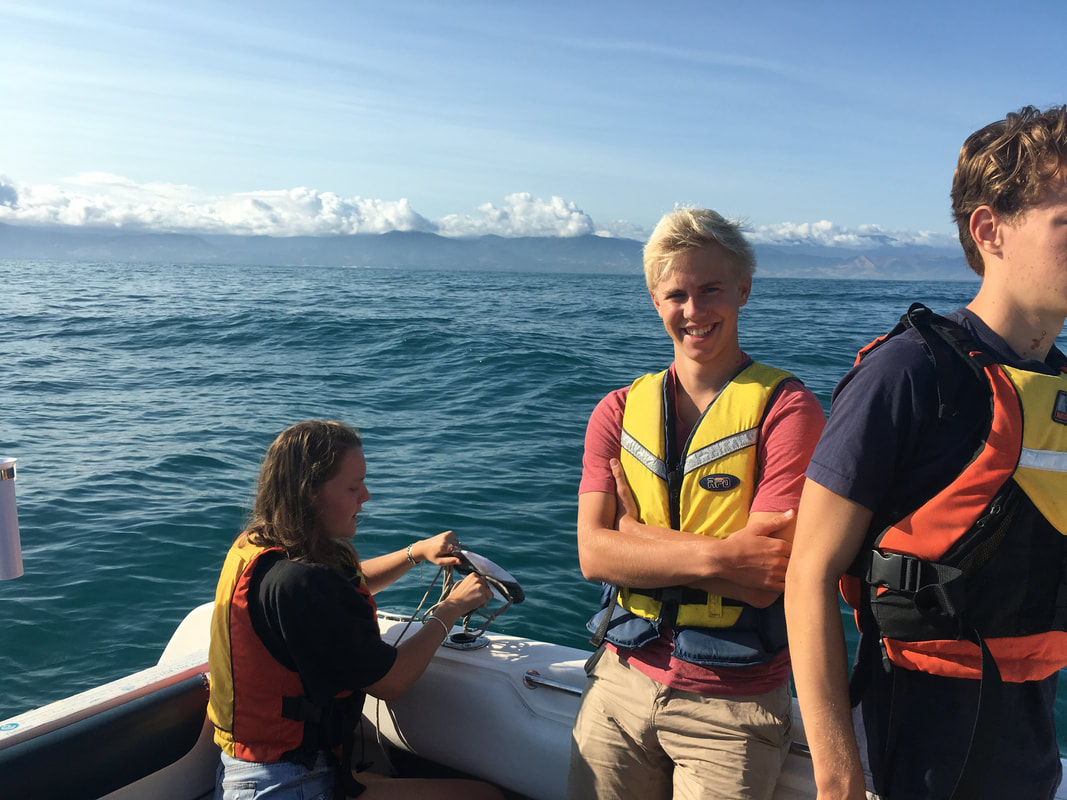
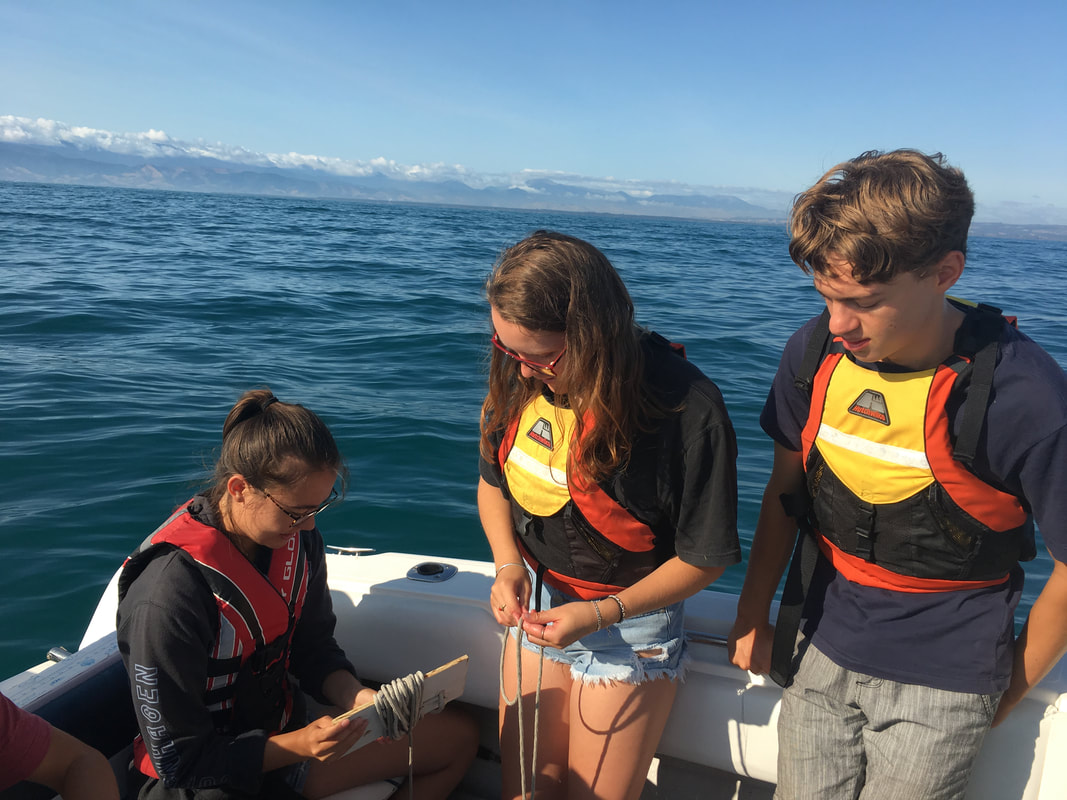
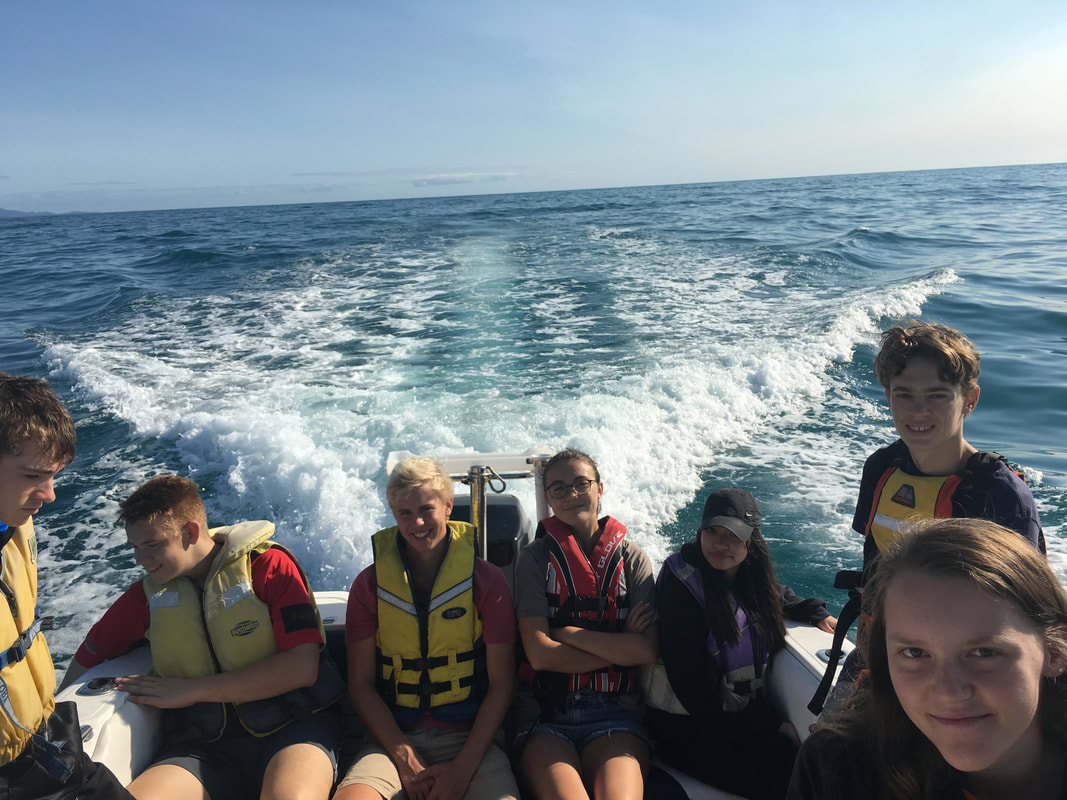
Plankton trip Feb 2023
More on this and what we found on our OneNote page (Content Library) .... Plankton trip 23
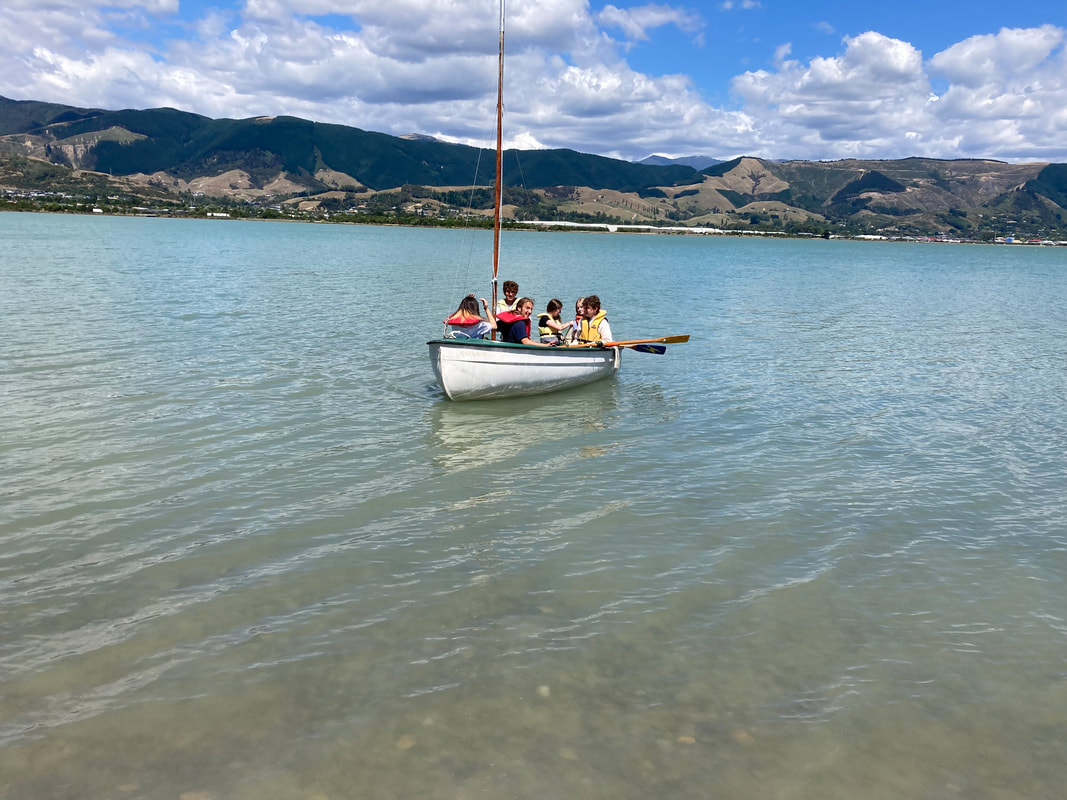
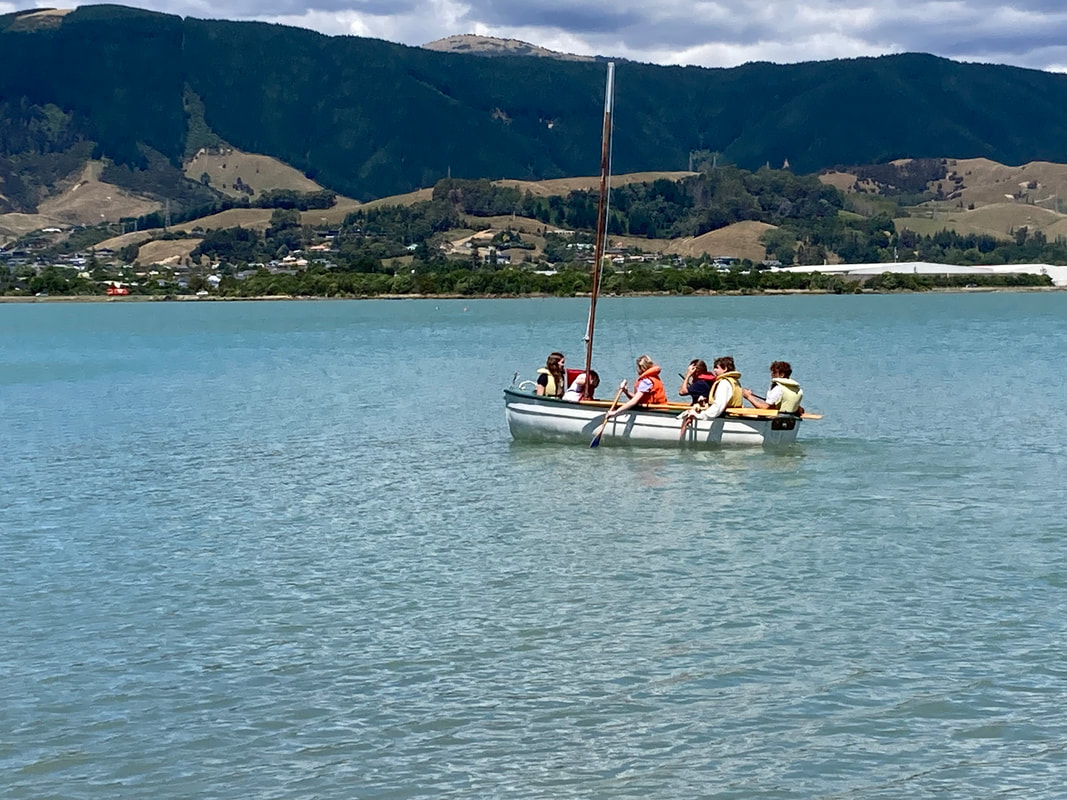
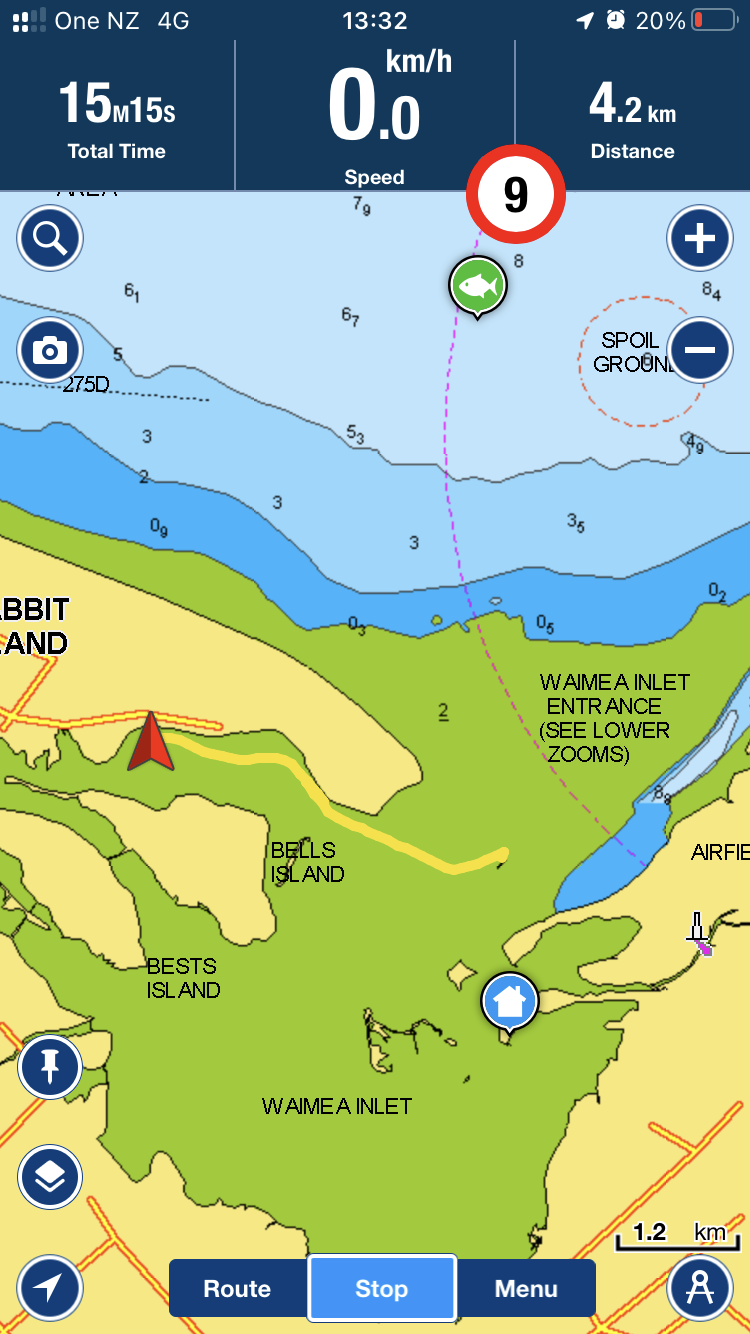
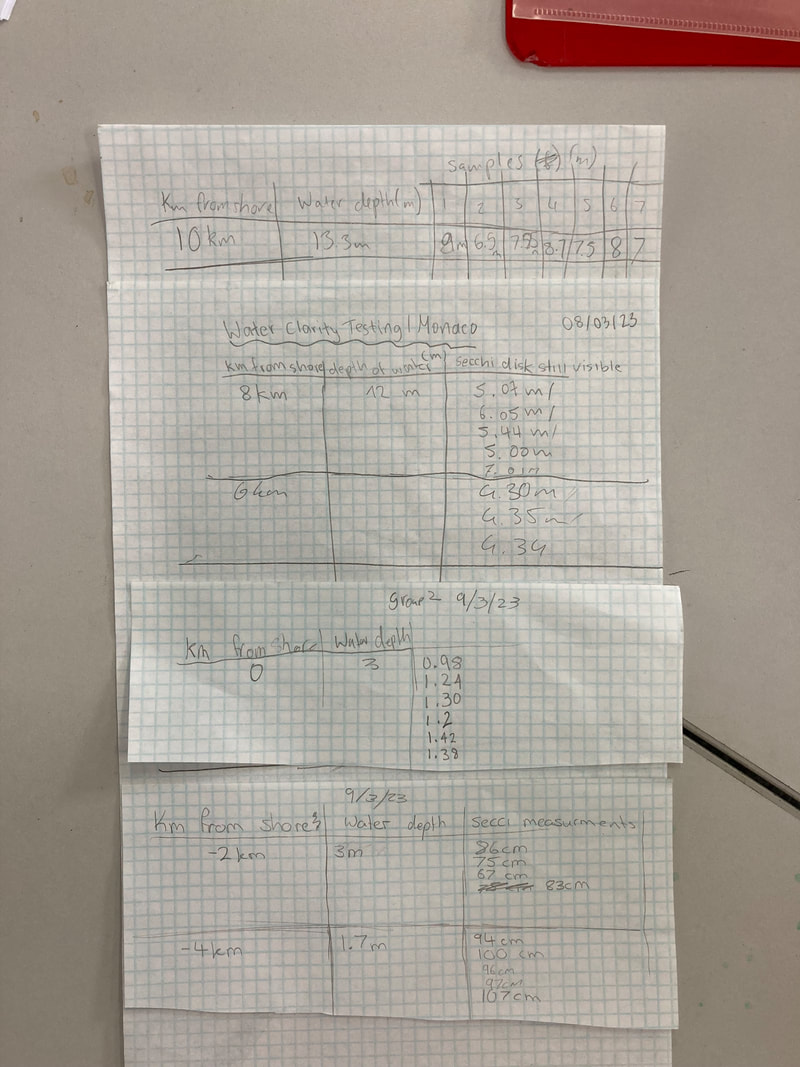
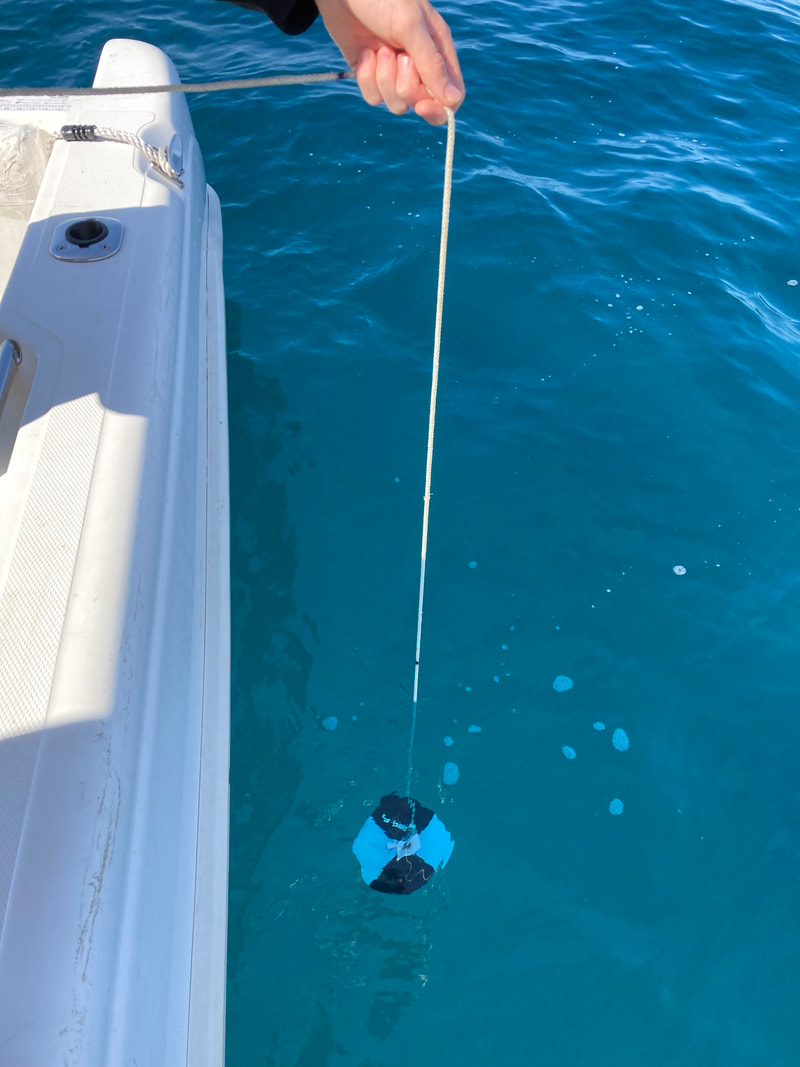
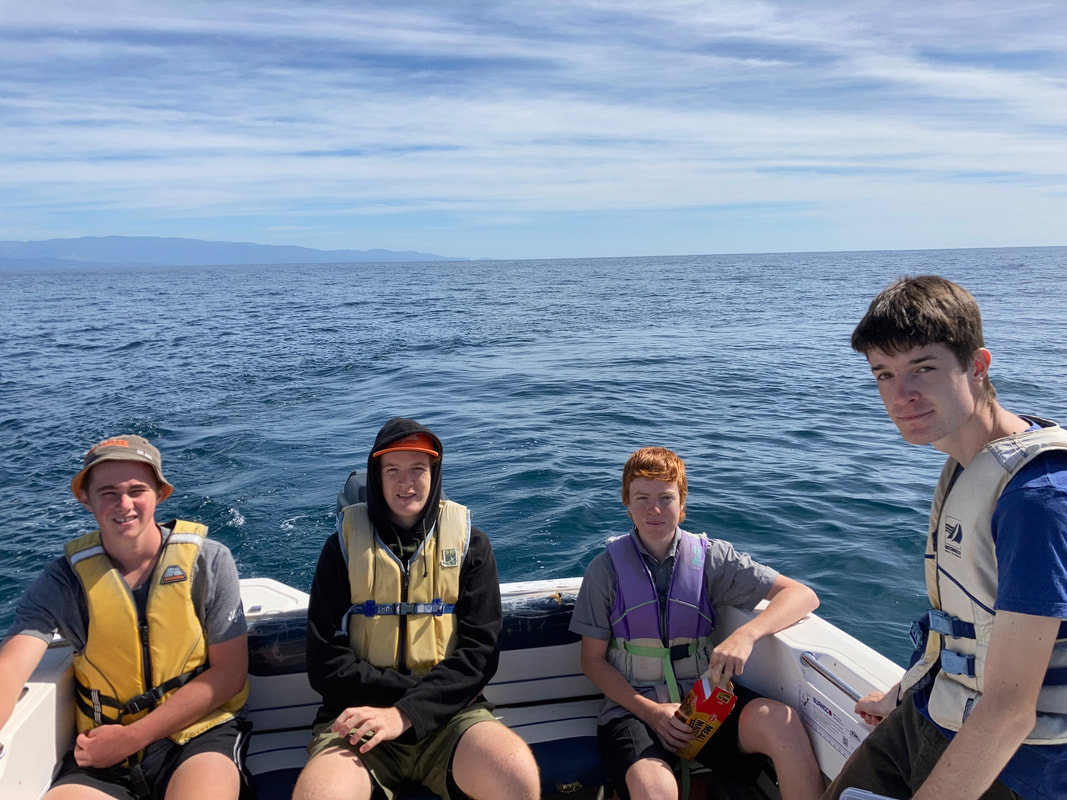
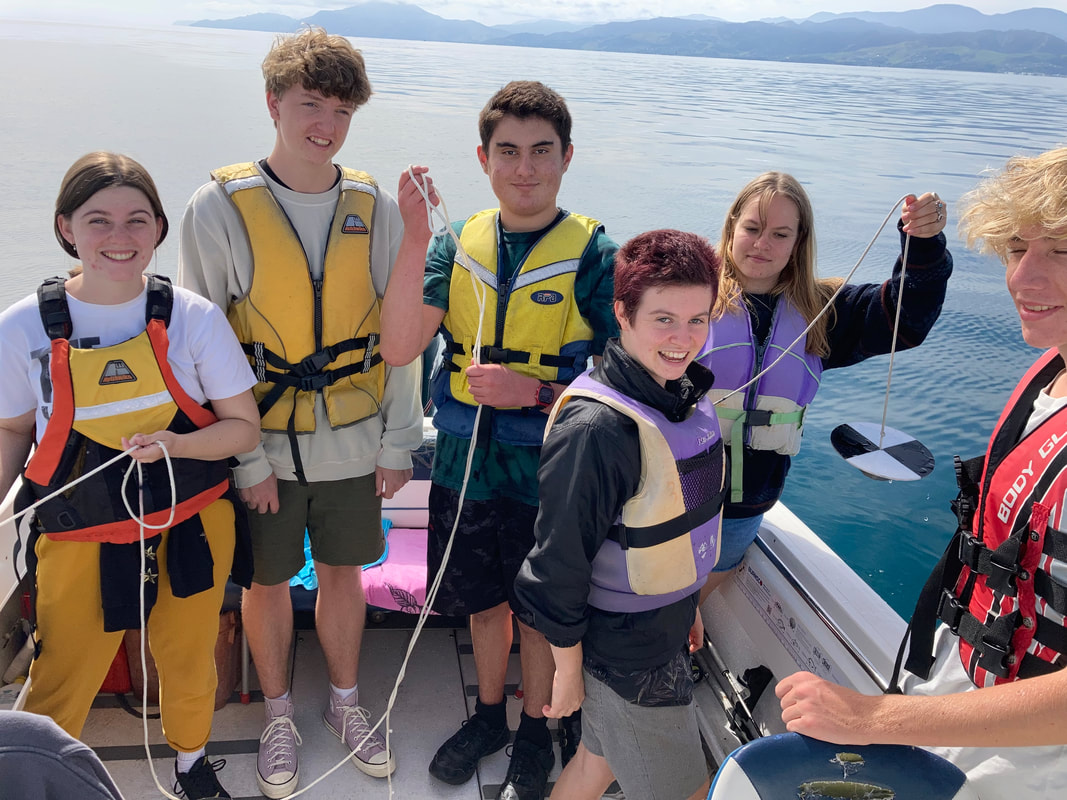
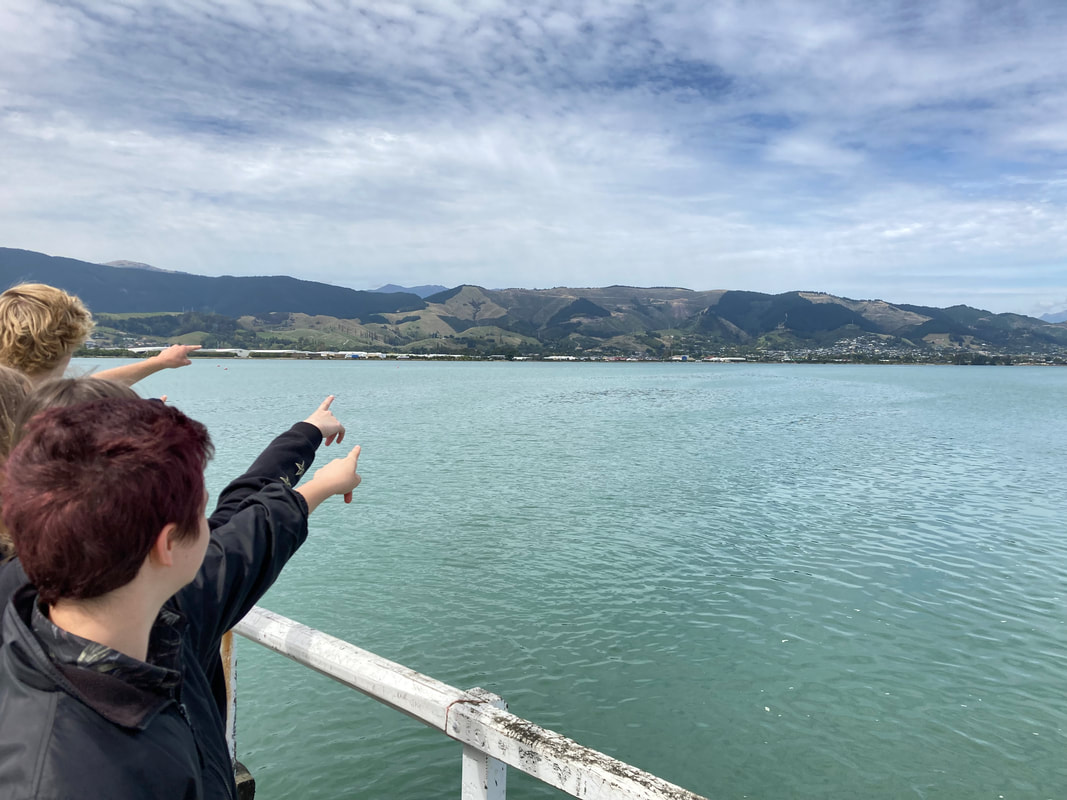
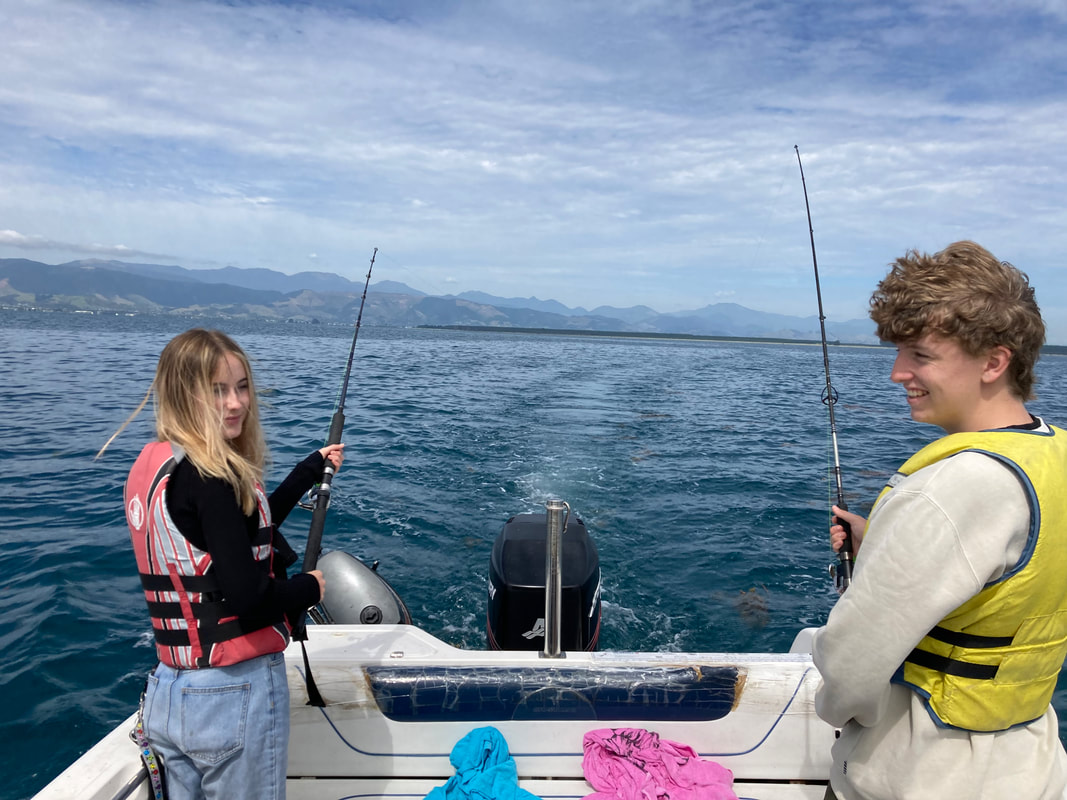
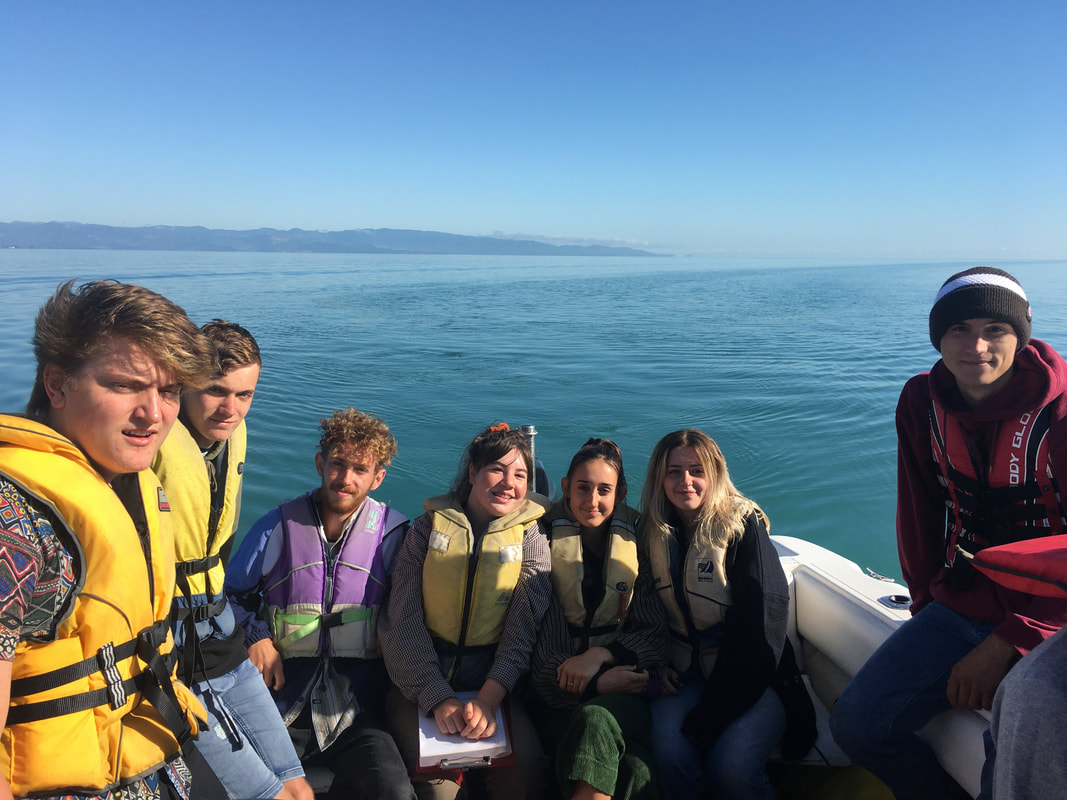
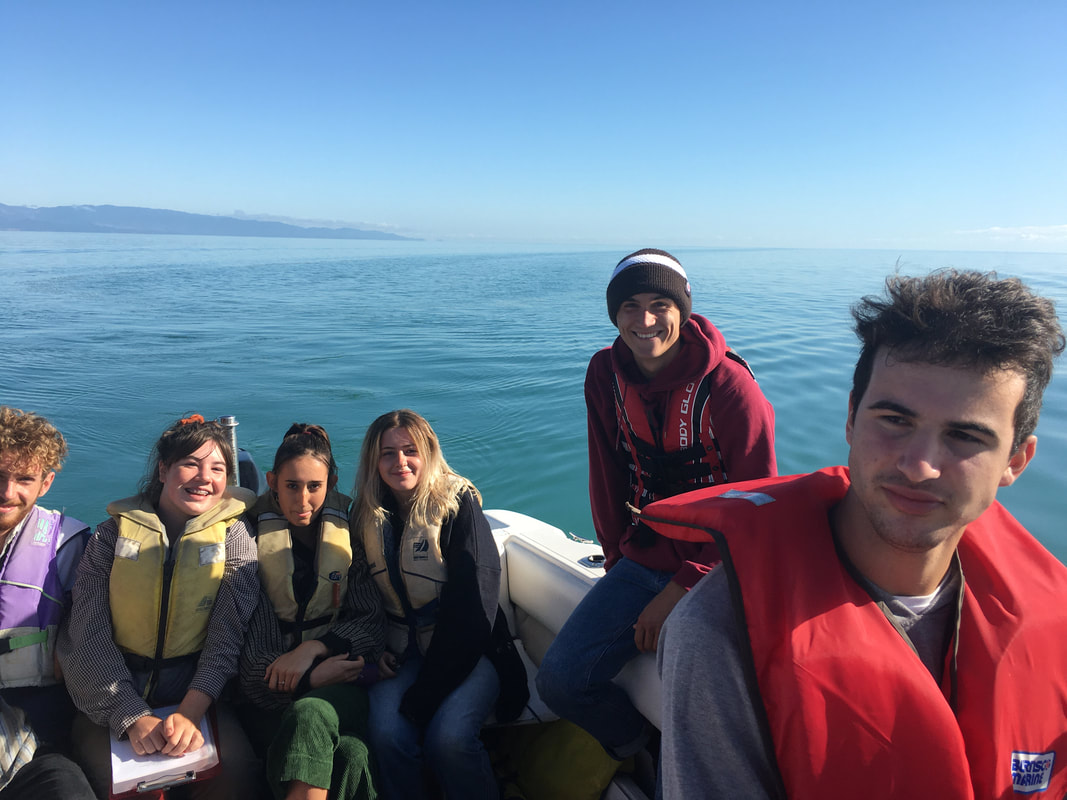
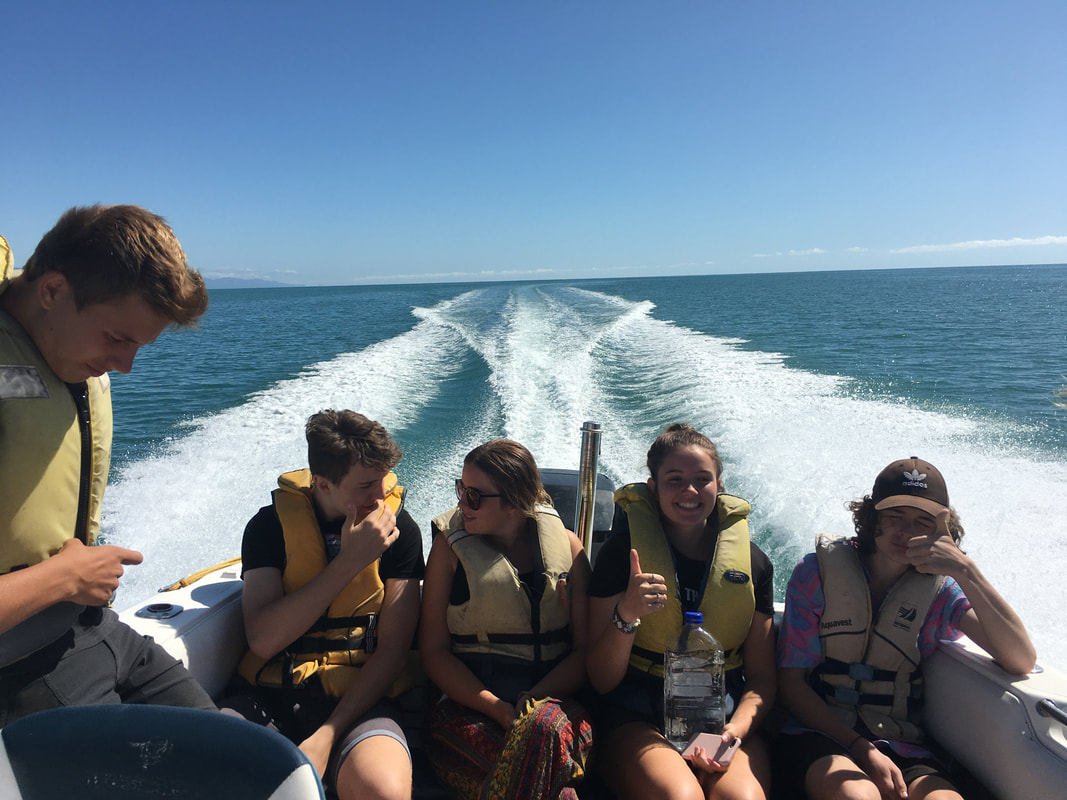
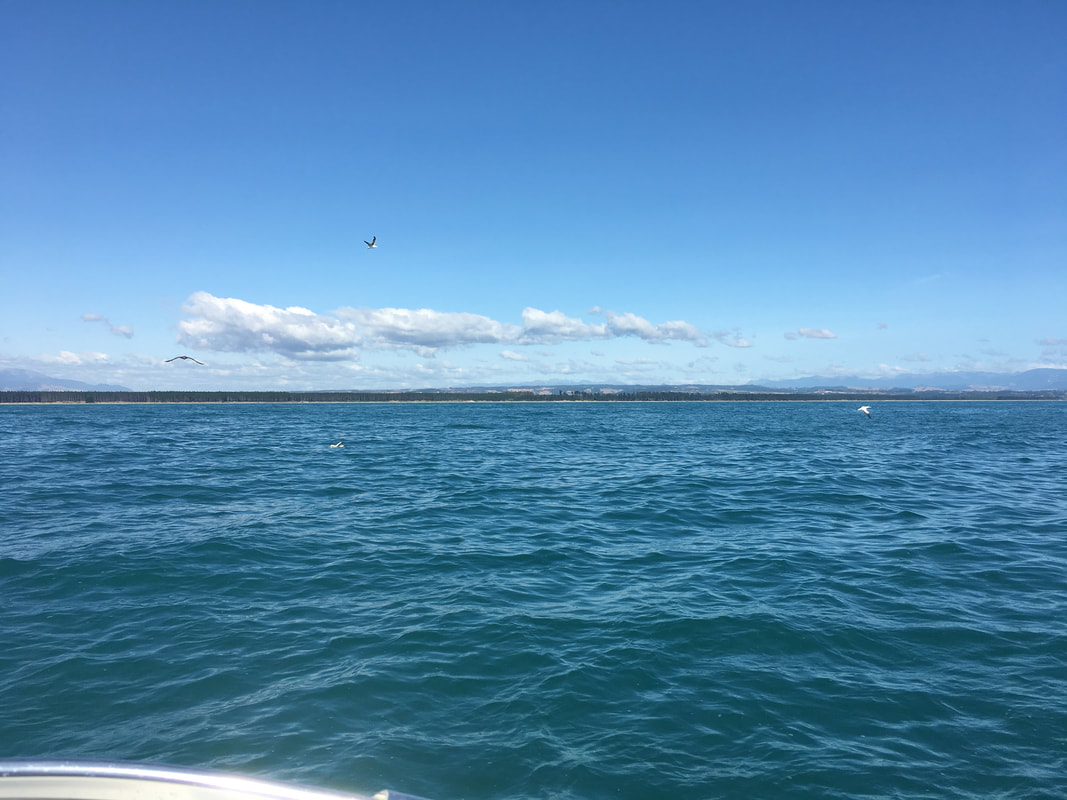
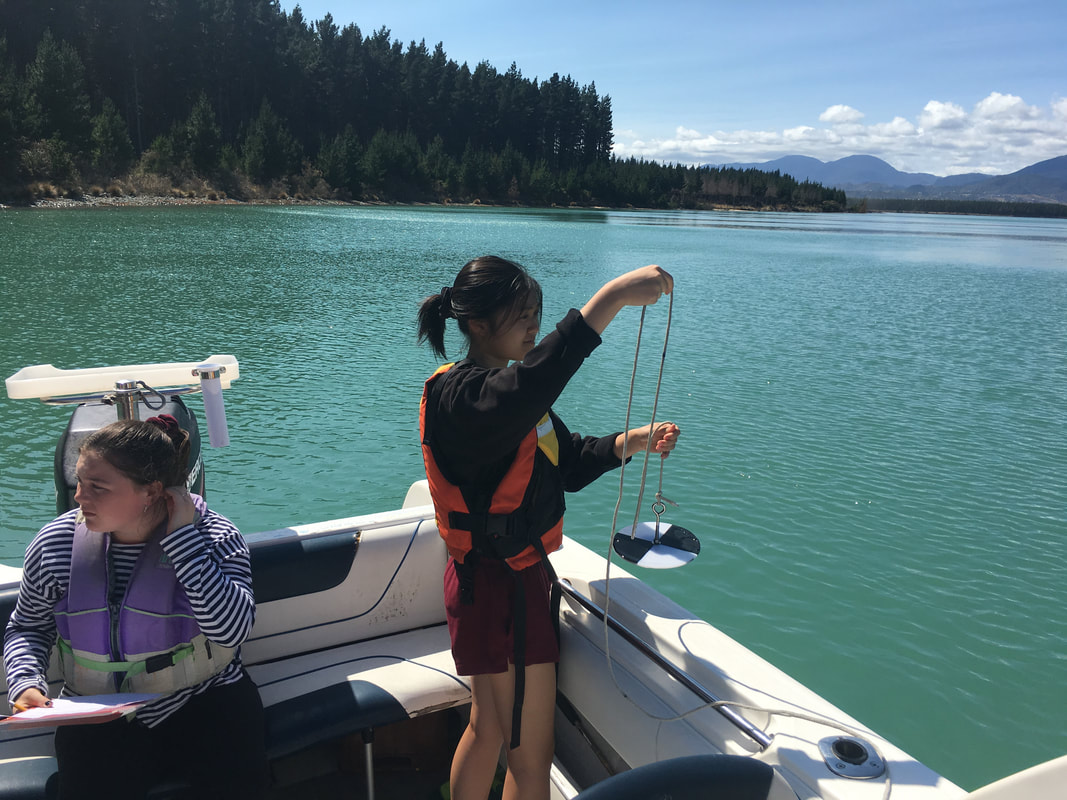
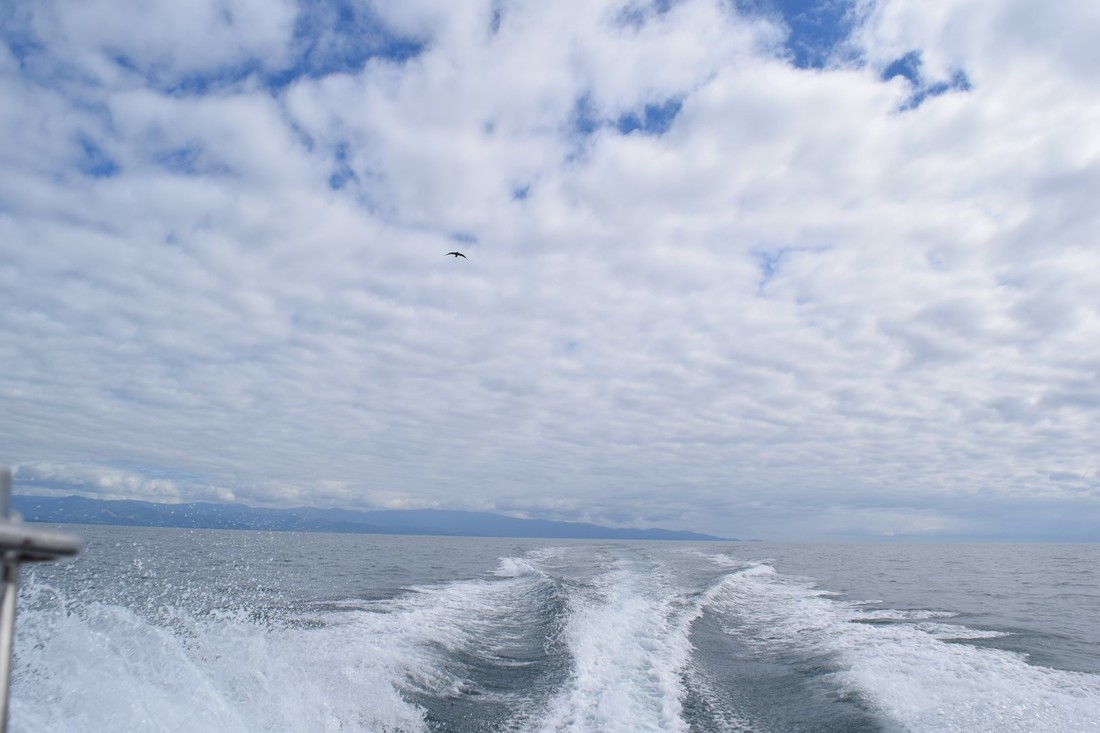
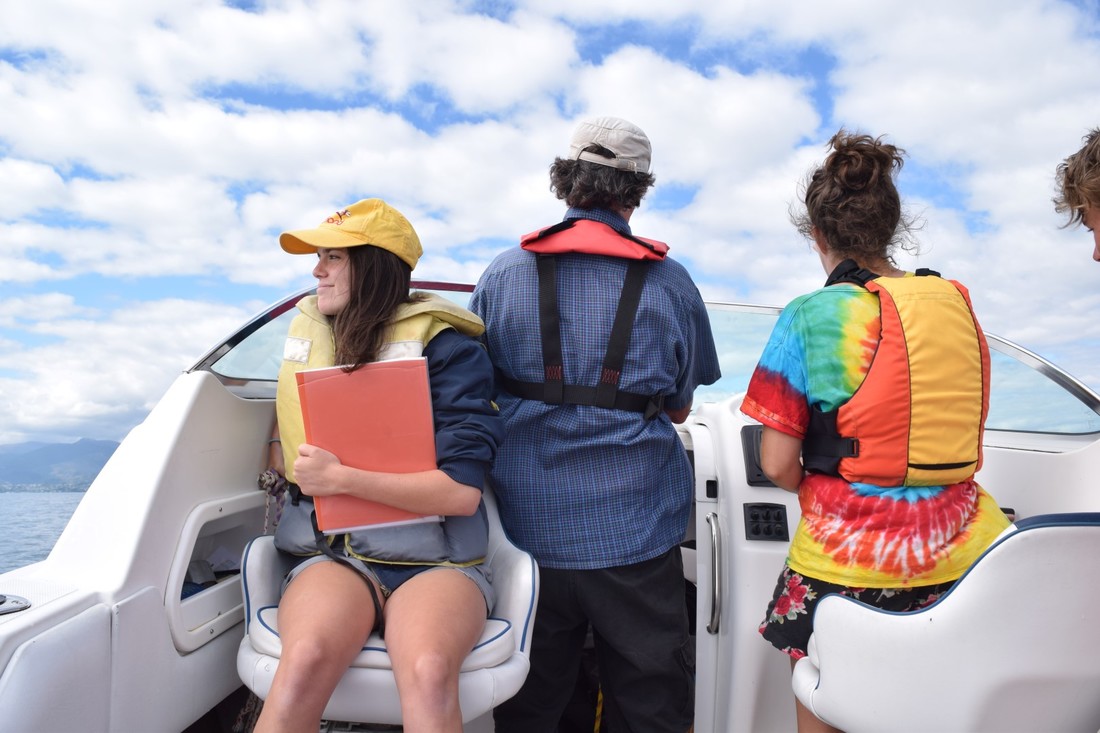
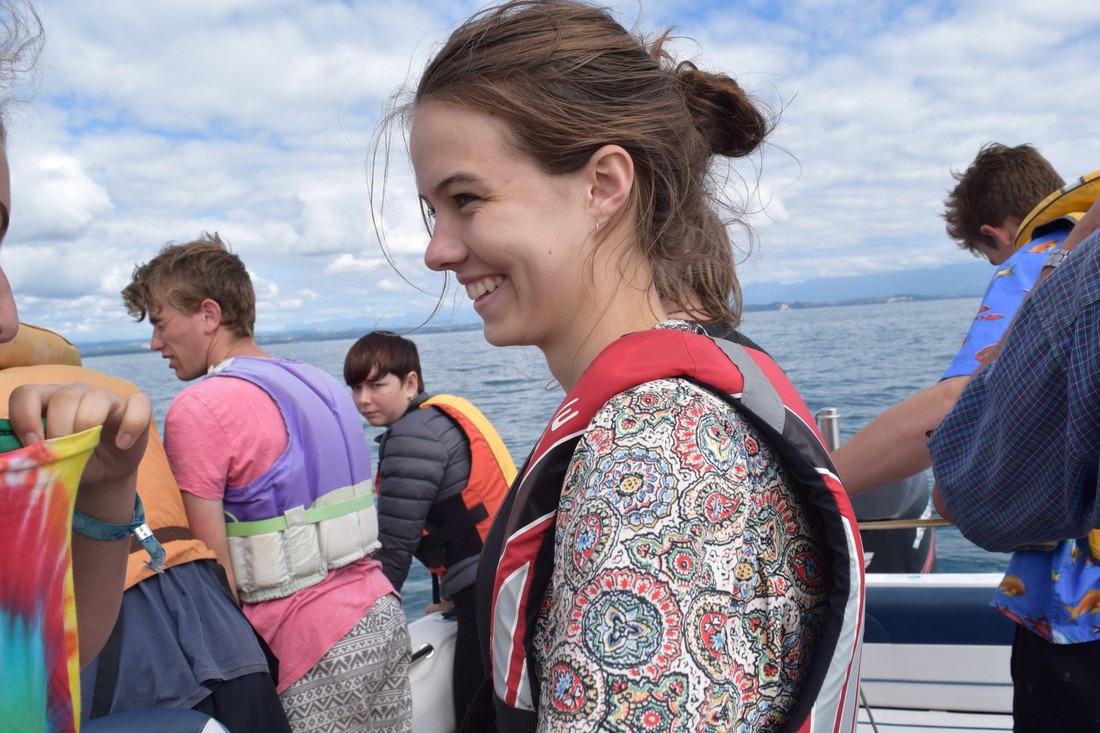
TasBay trips March 2023
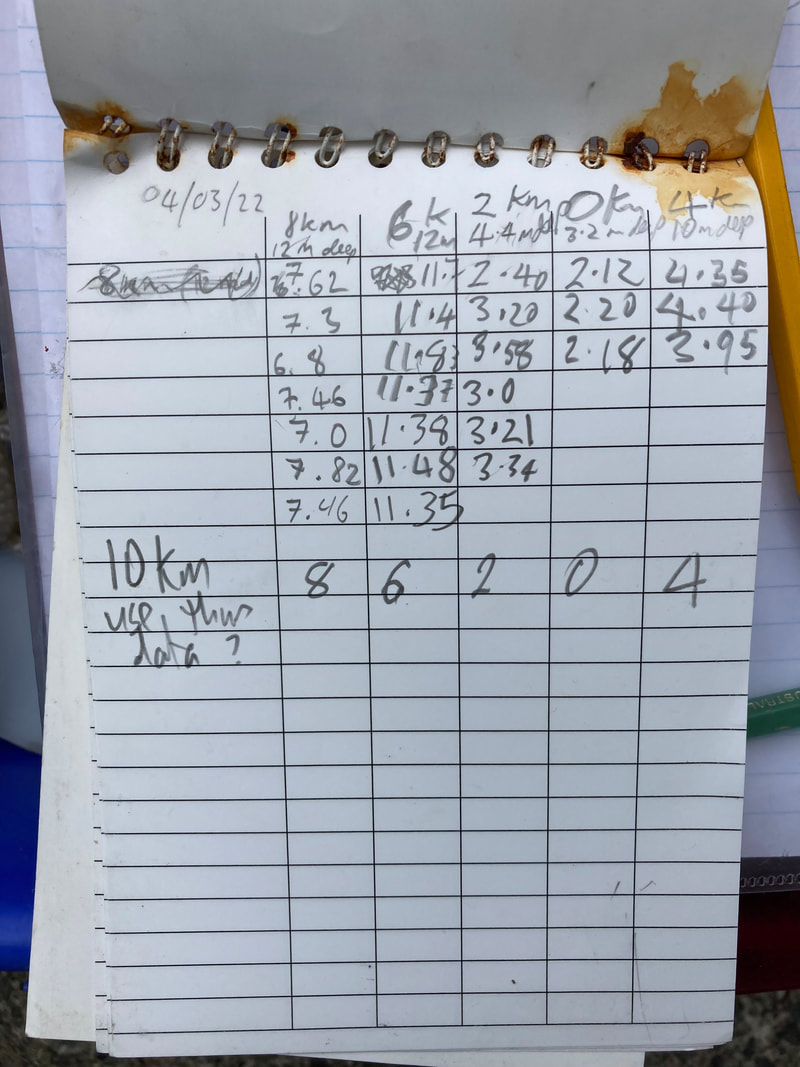
TasBay trips March 2022
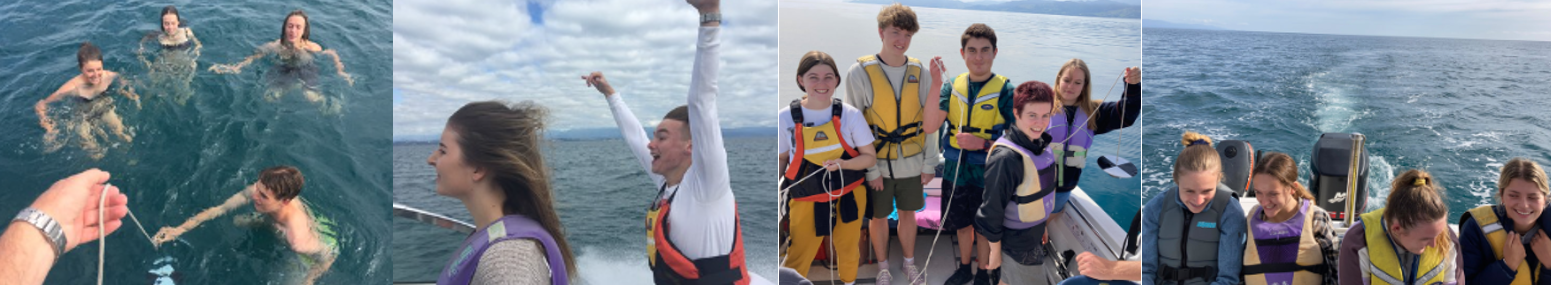
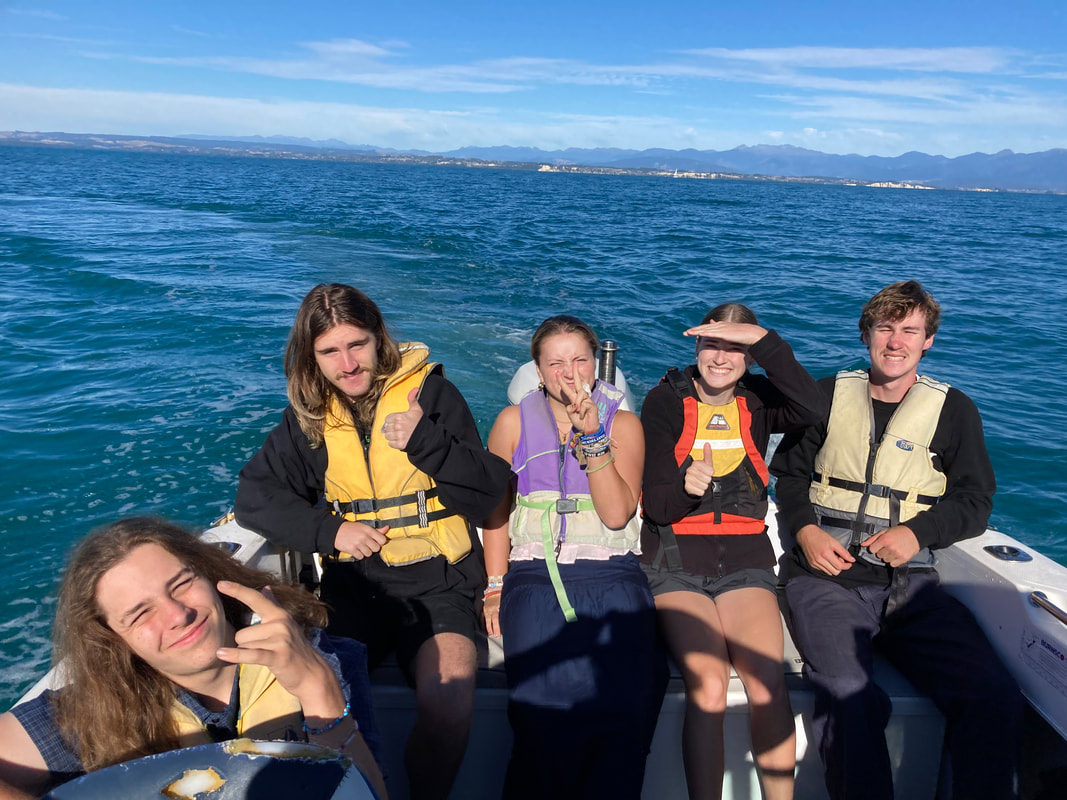
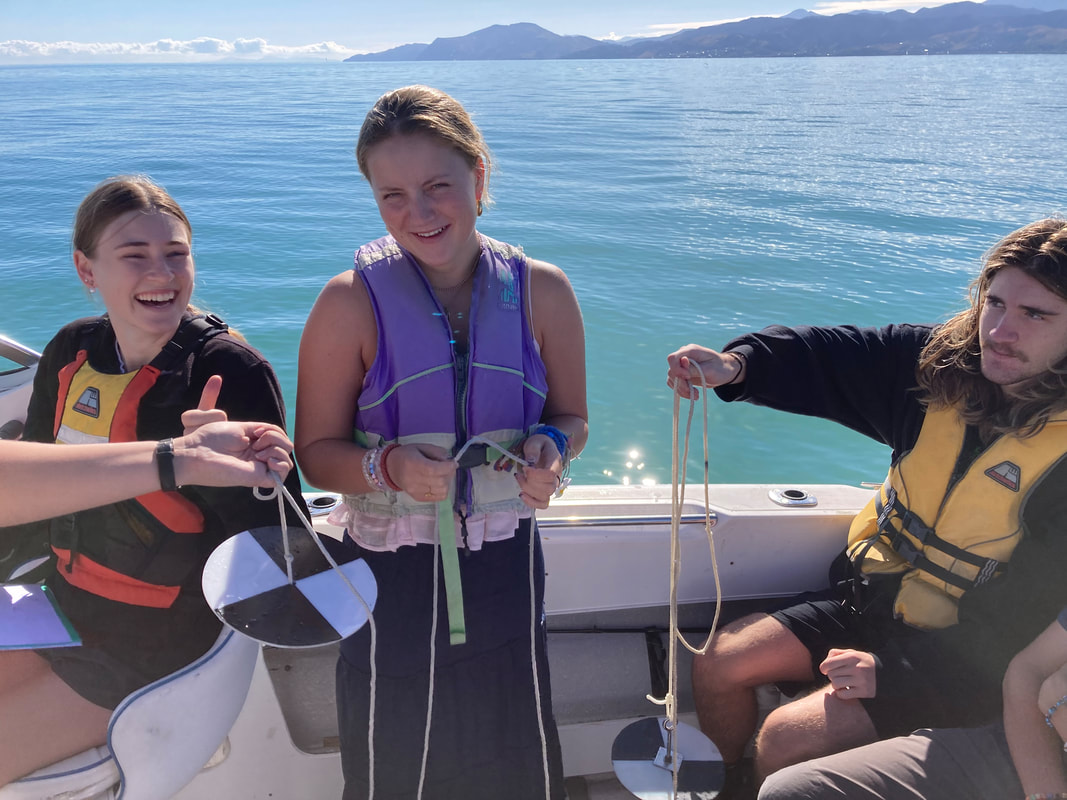
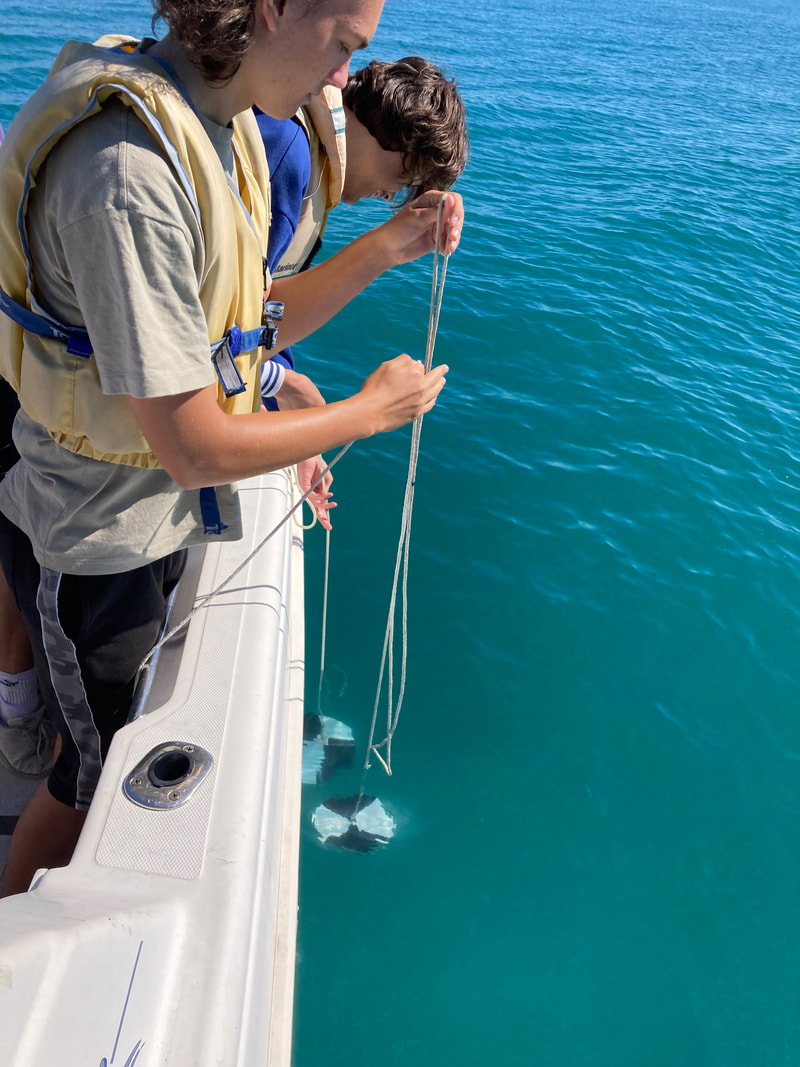
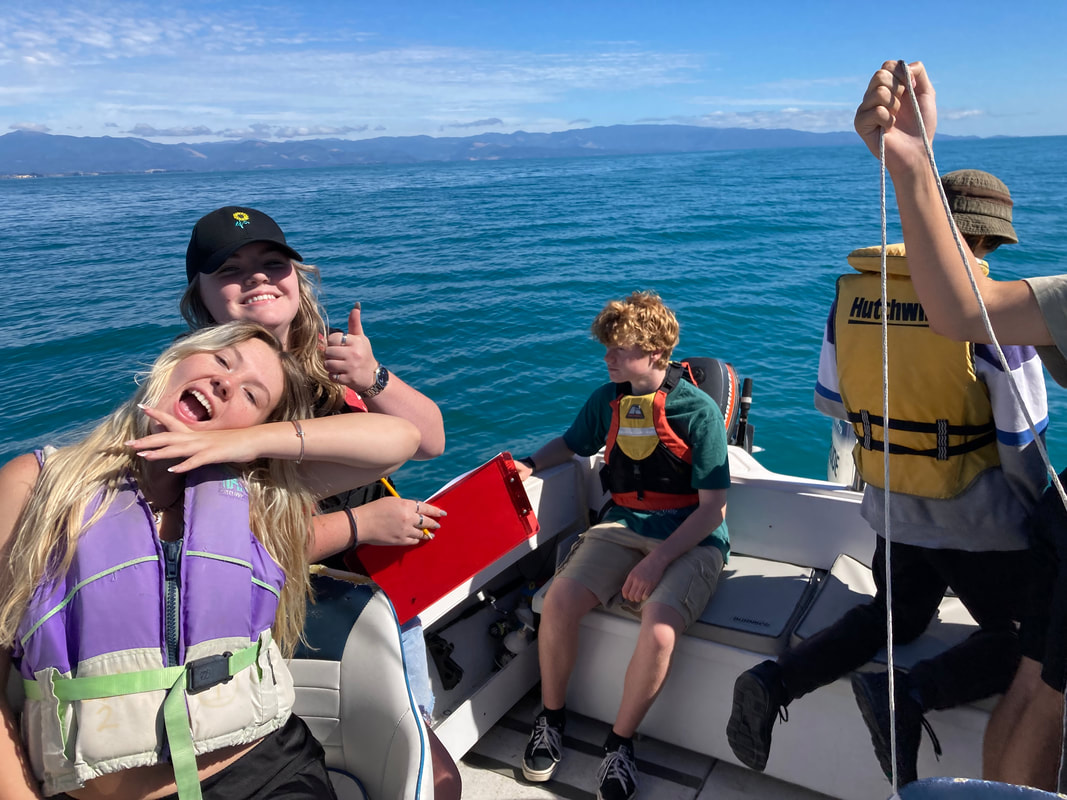
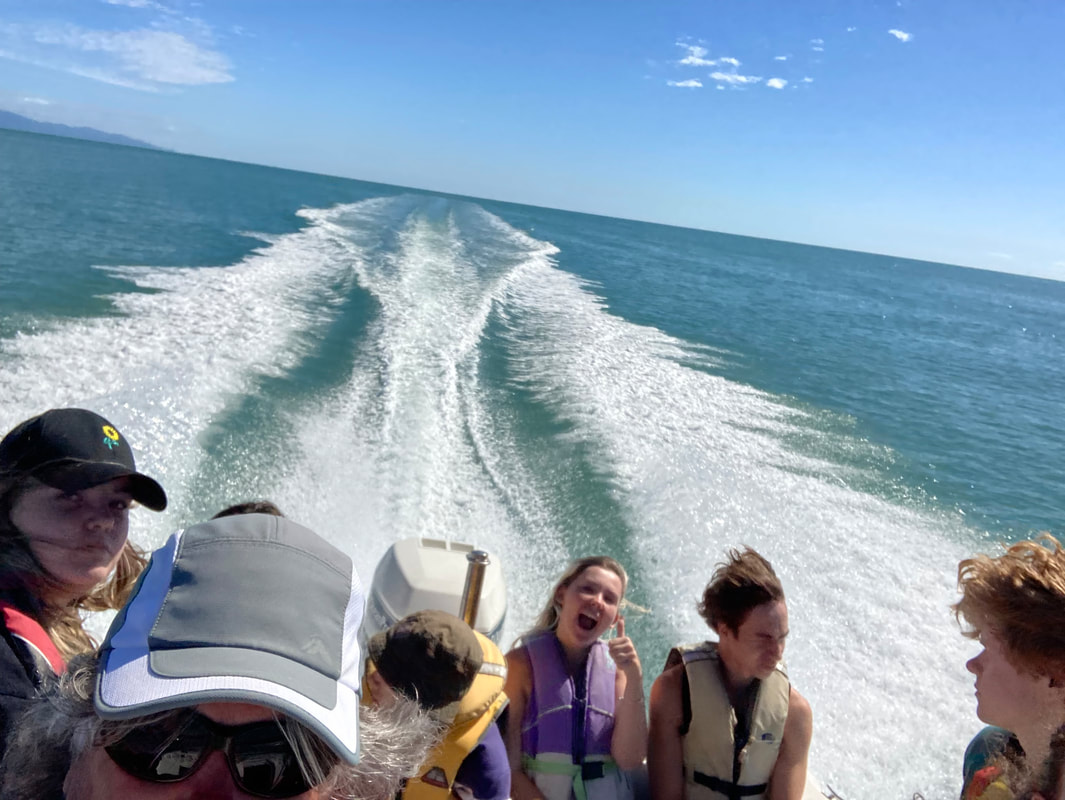
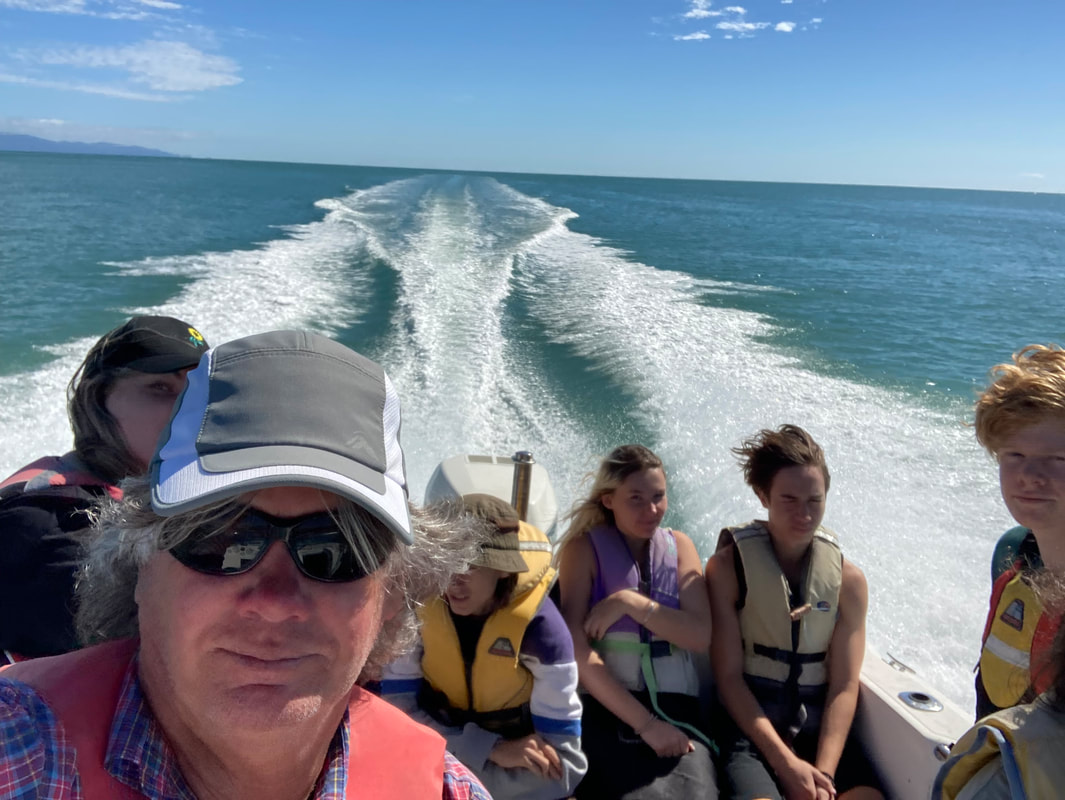
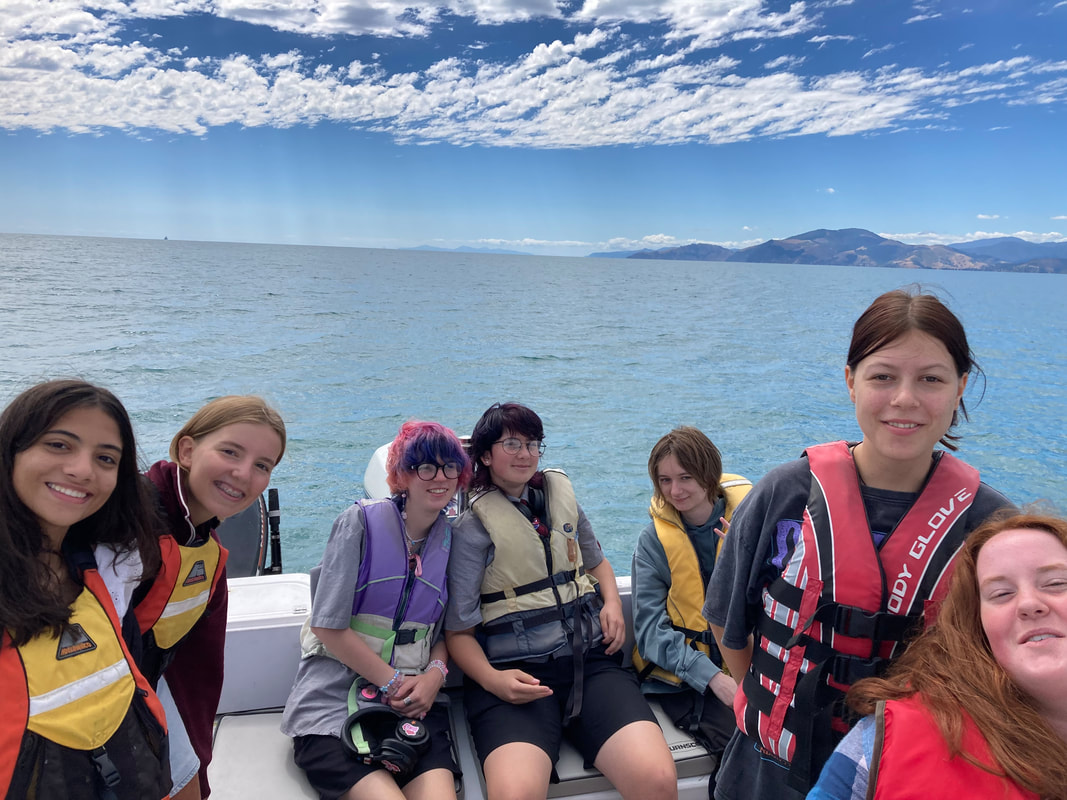
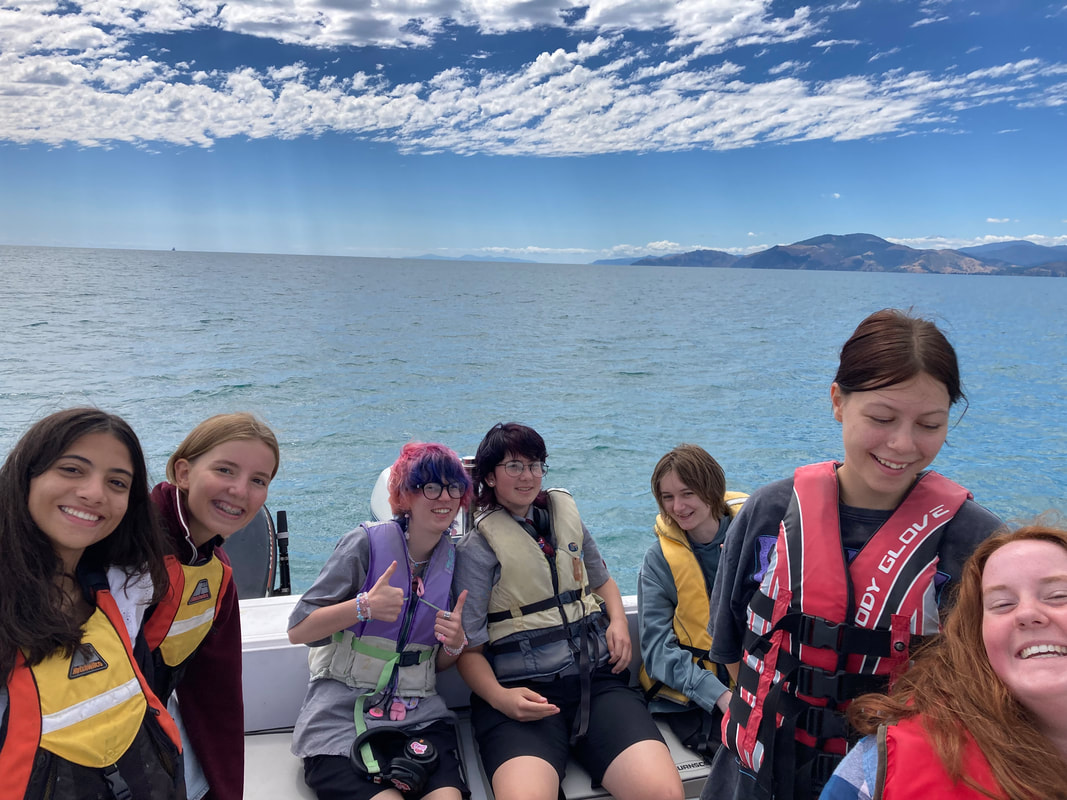
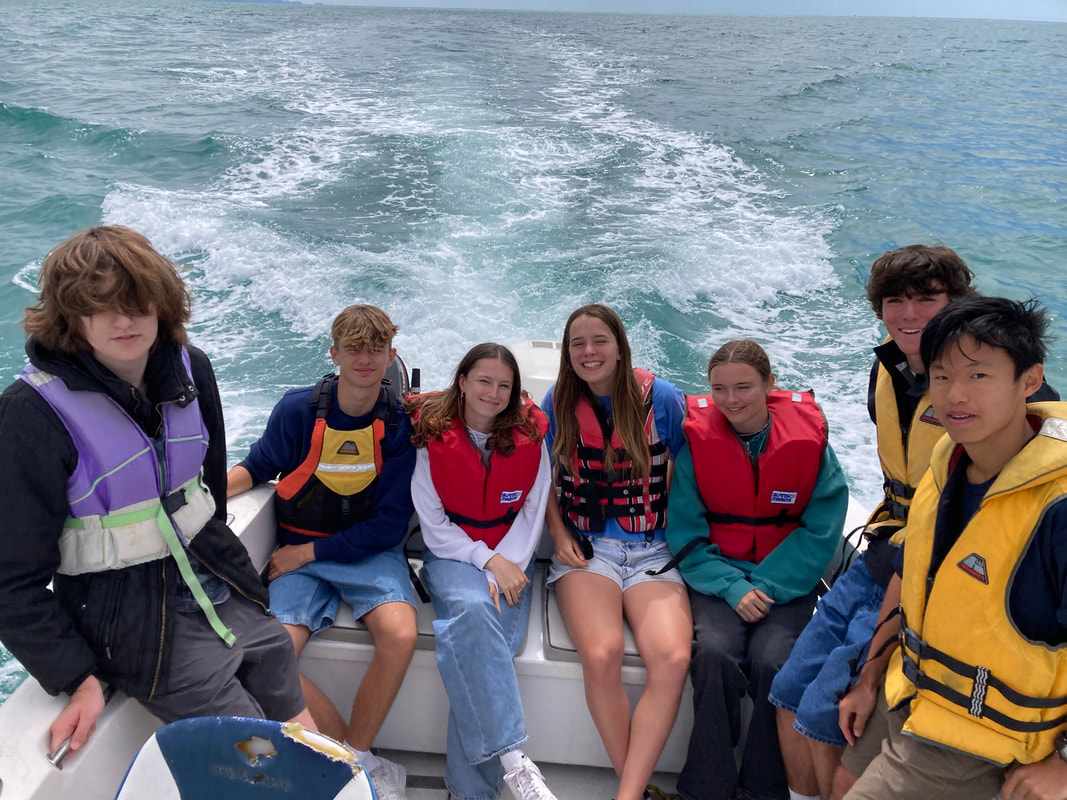
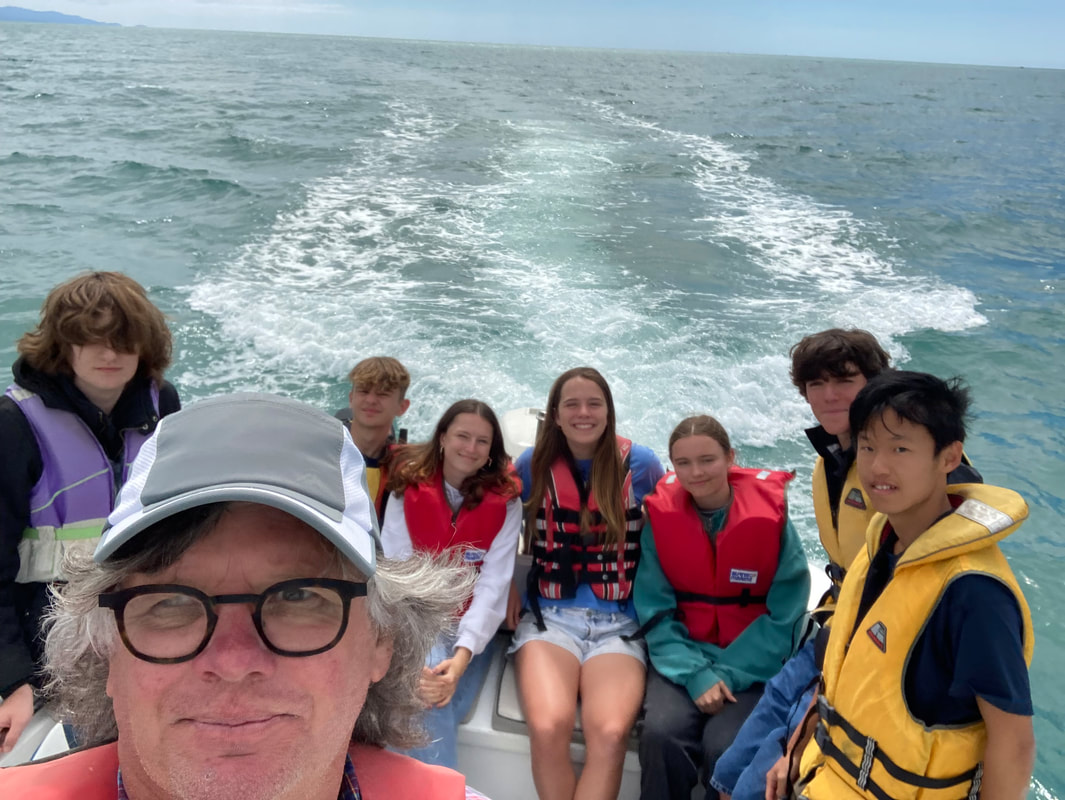
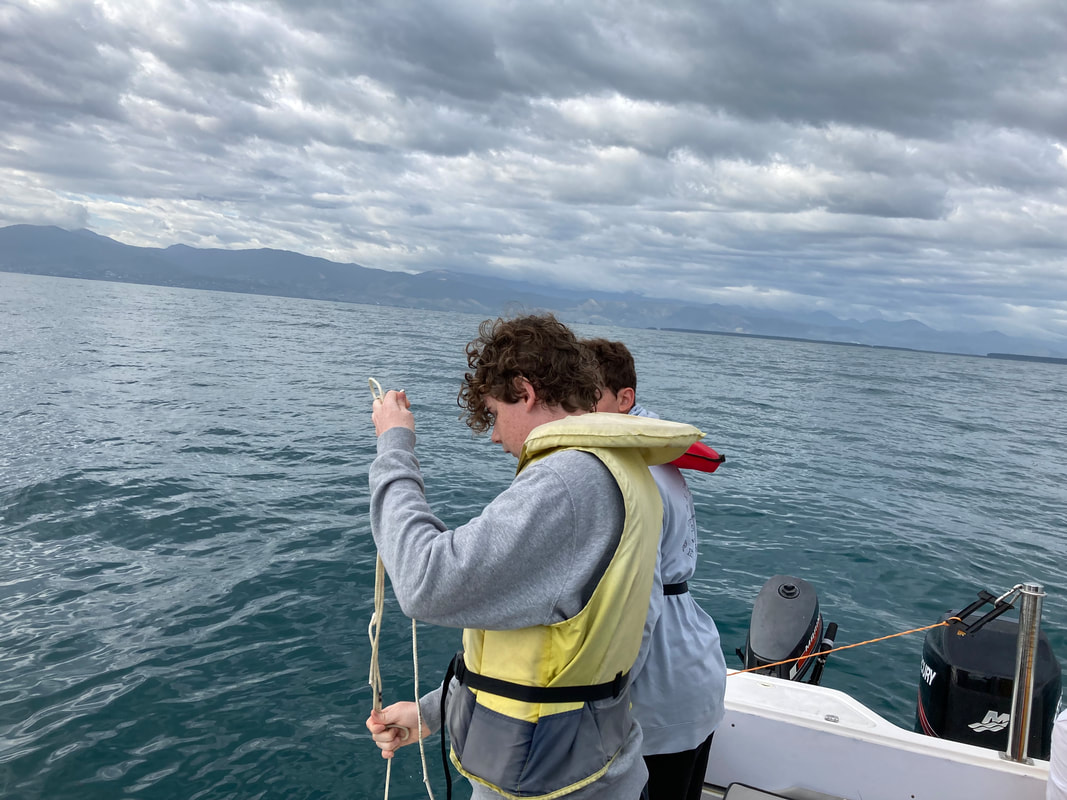
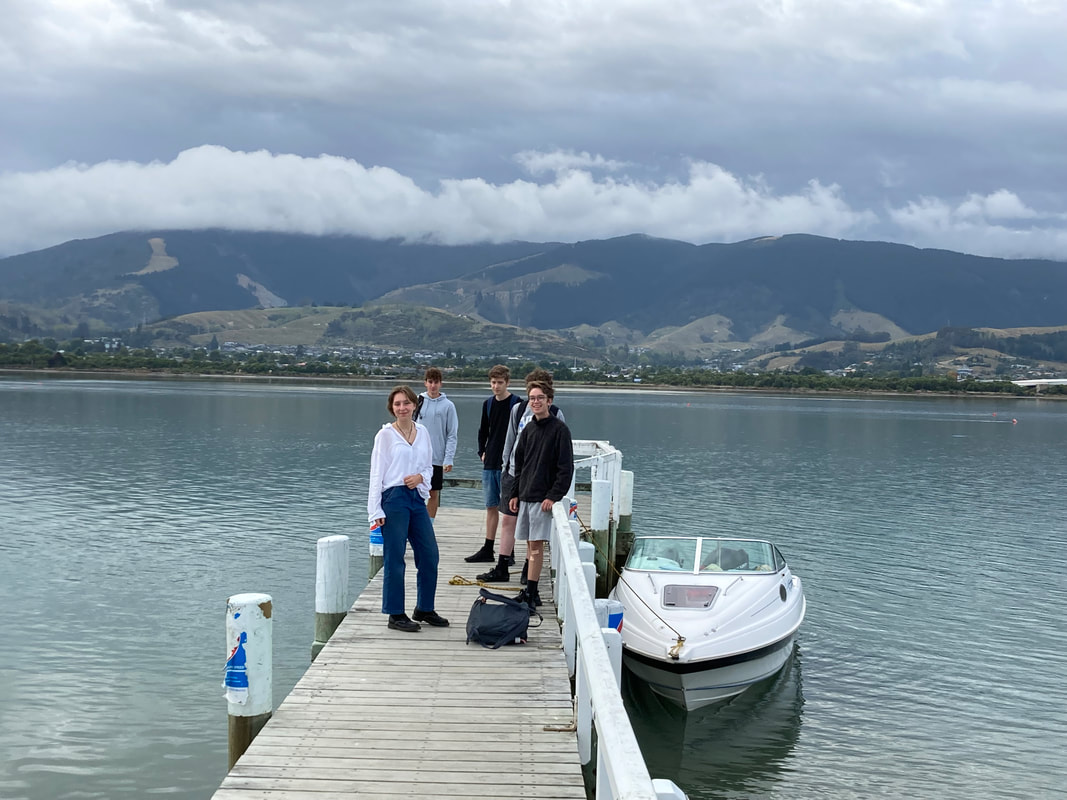
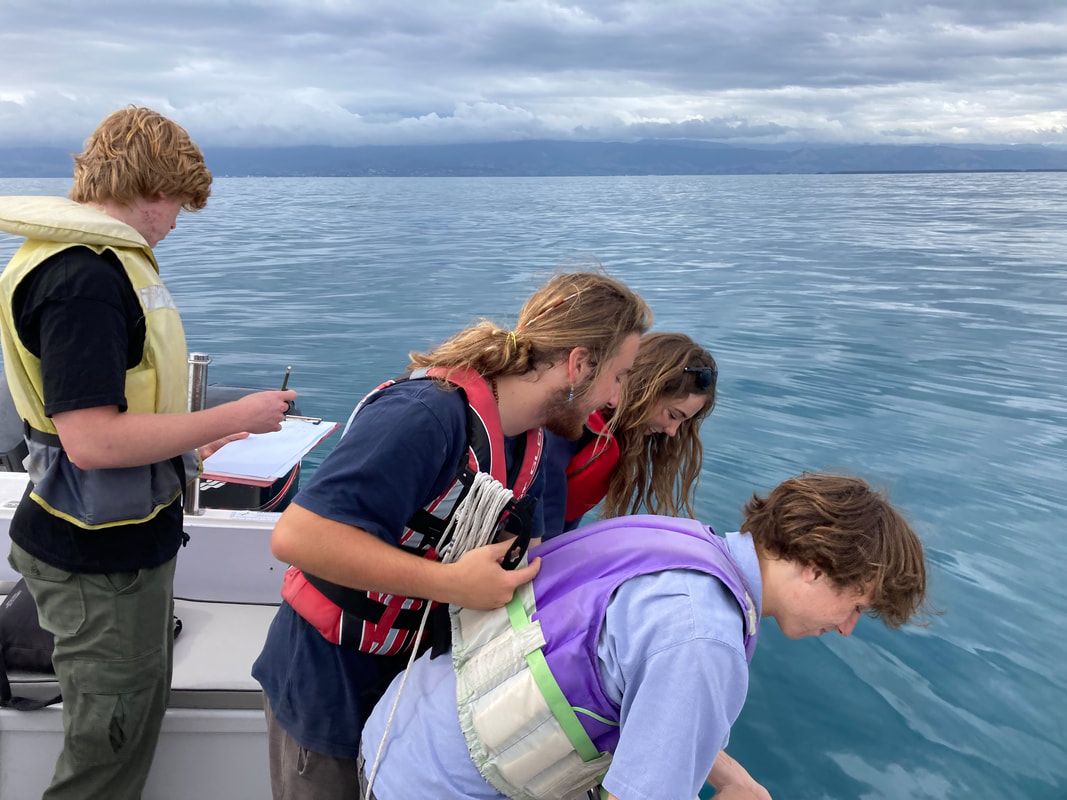
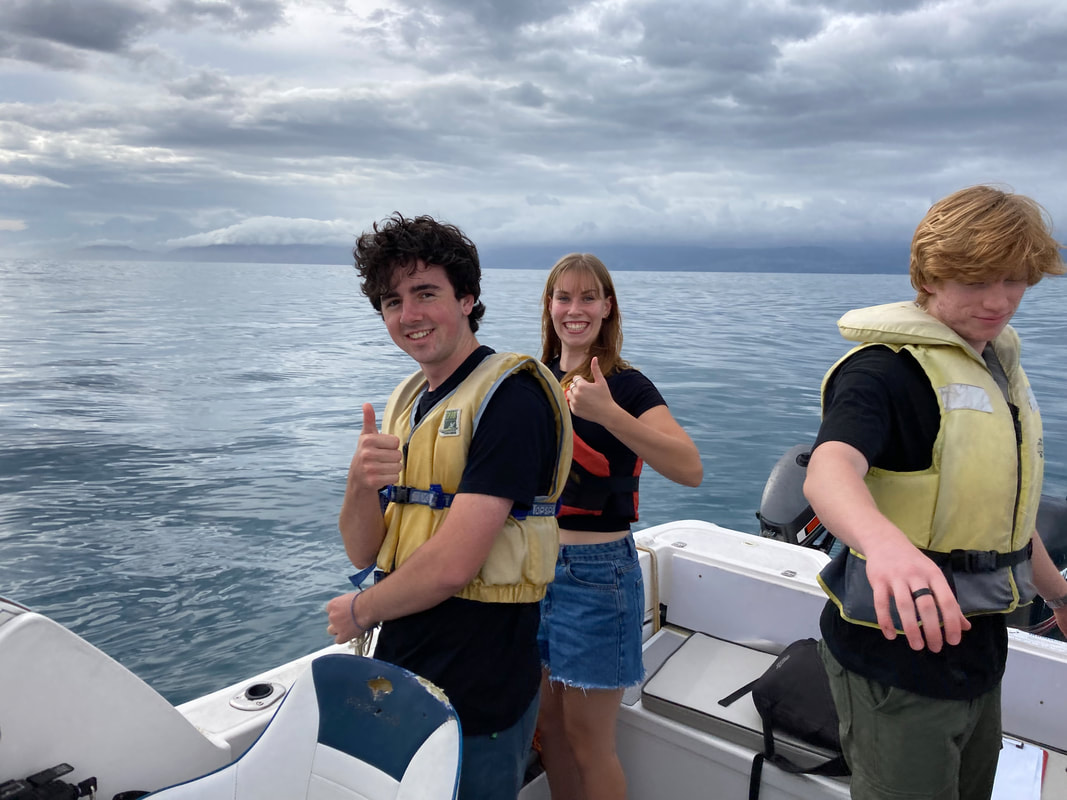
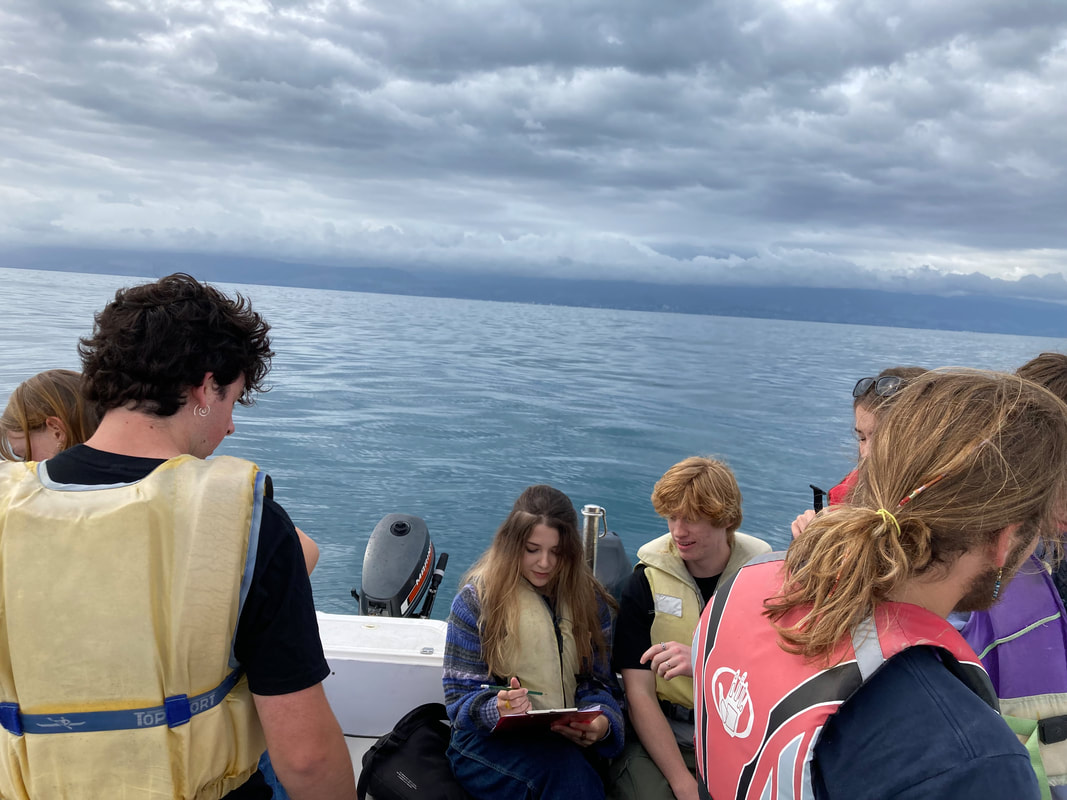
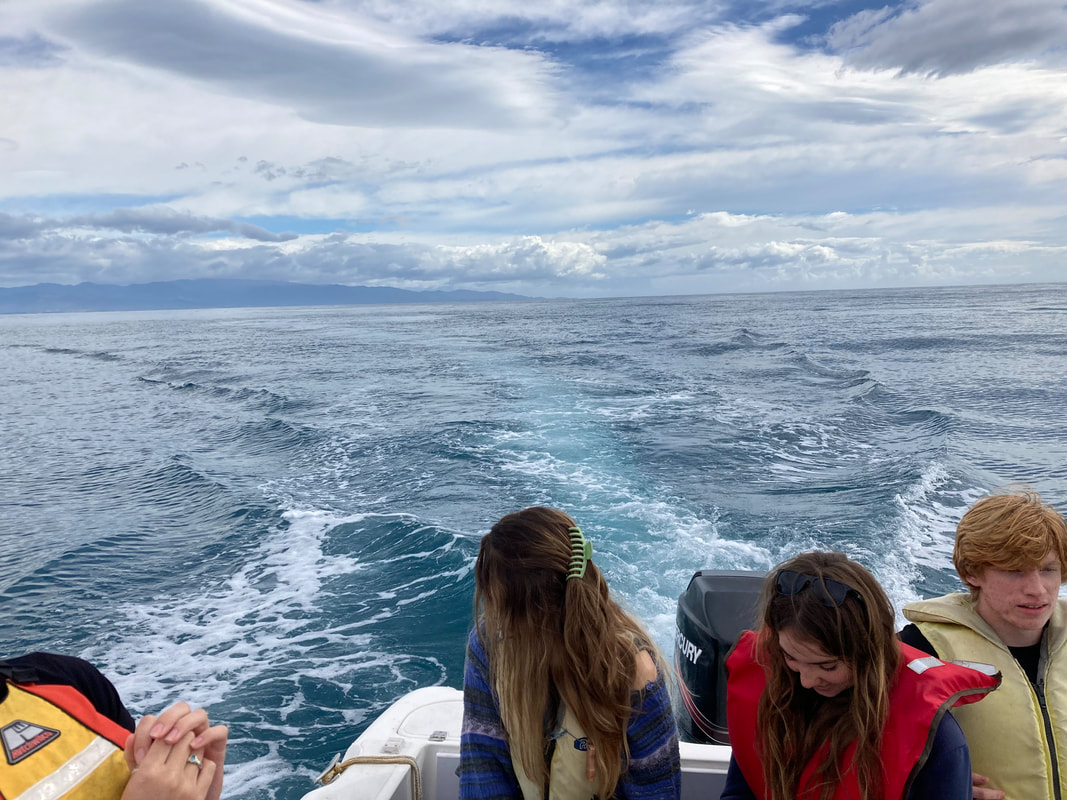
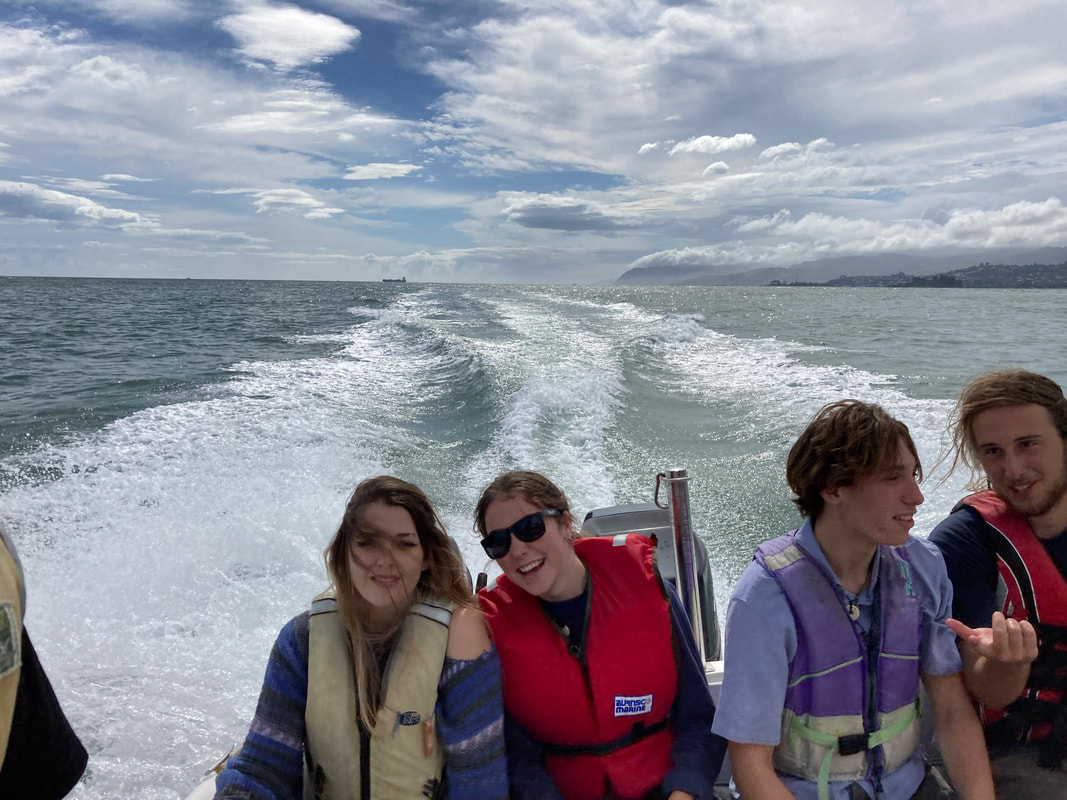
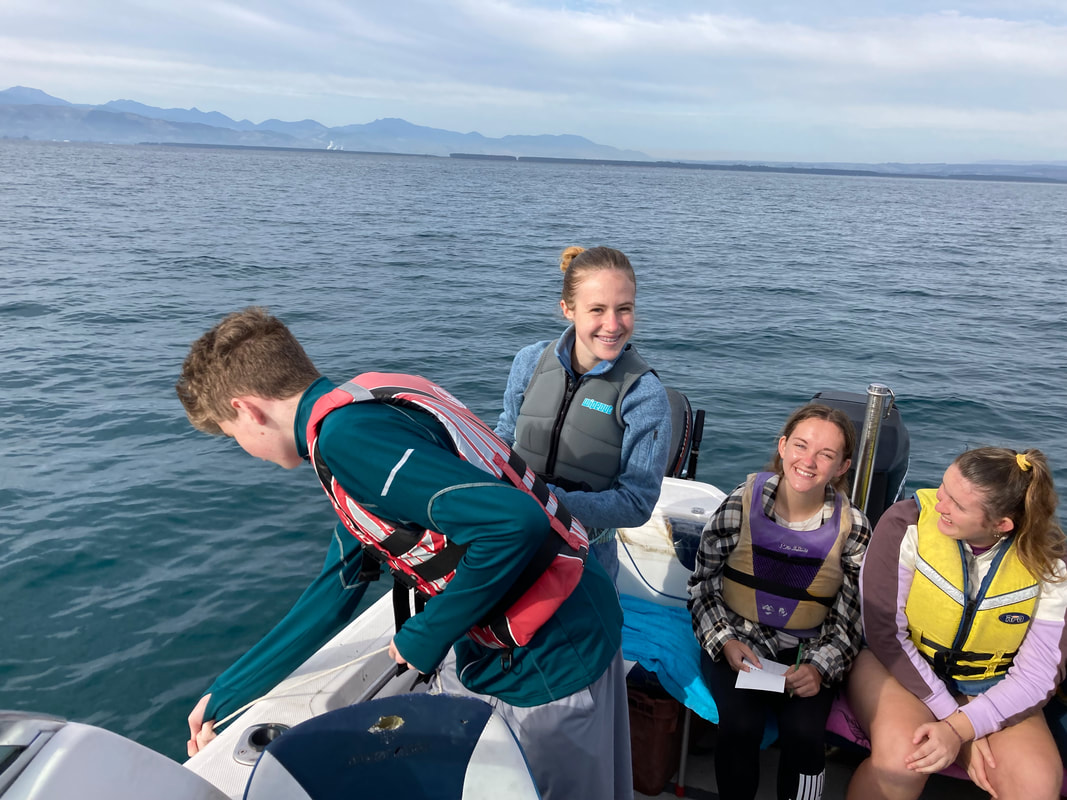
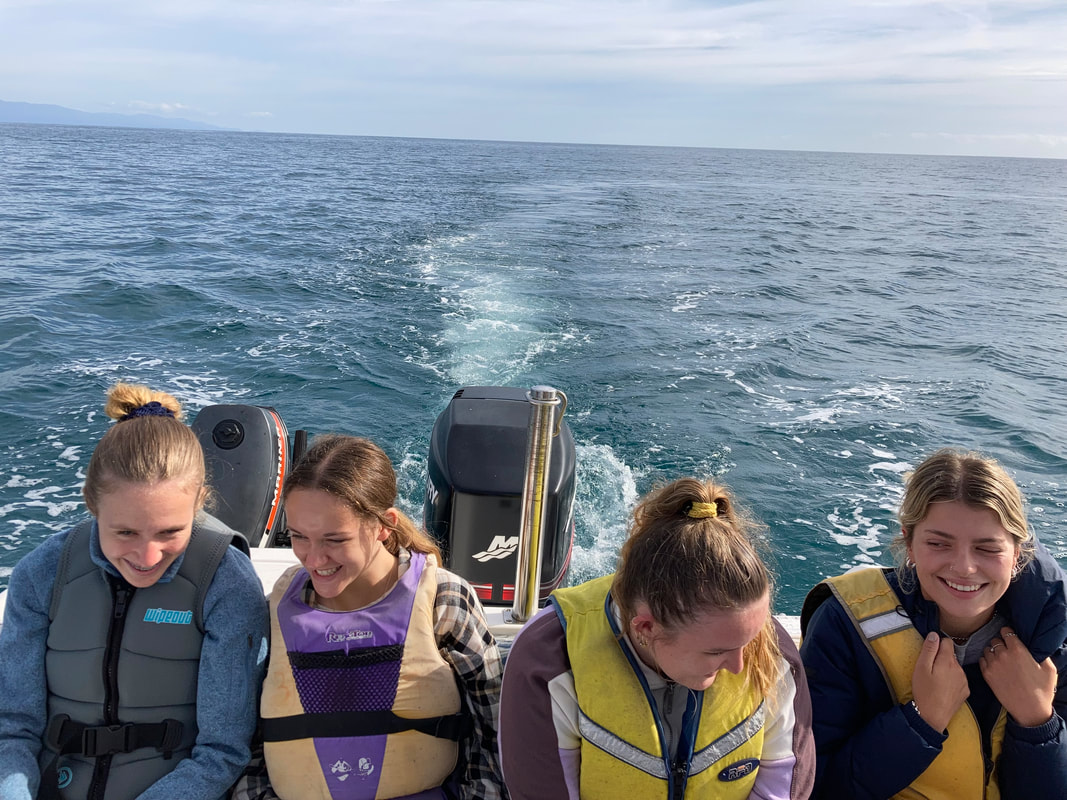
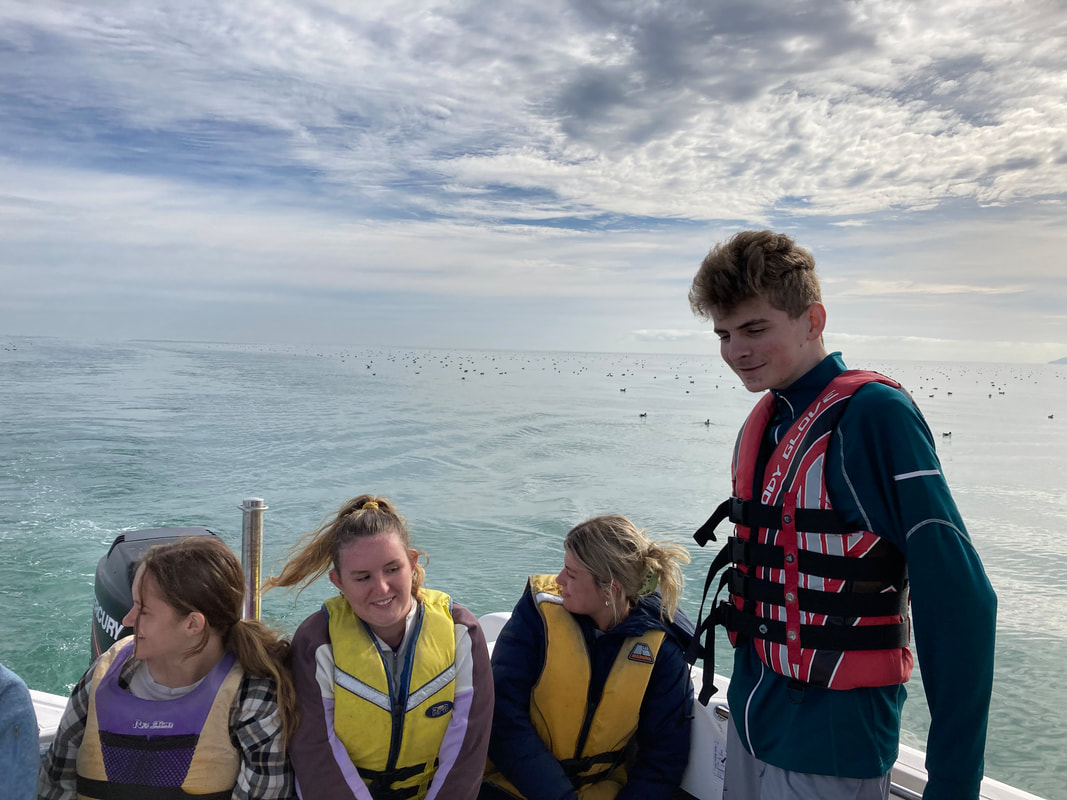
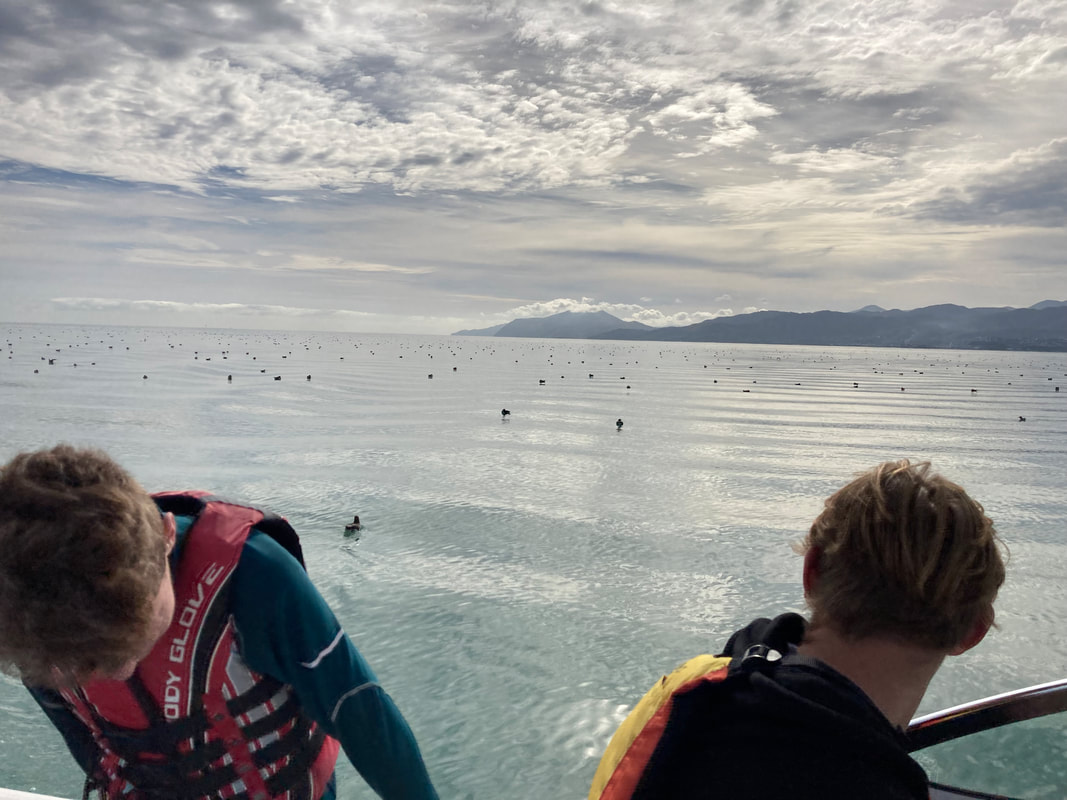
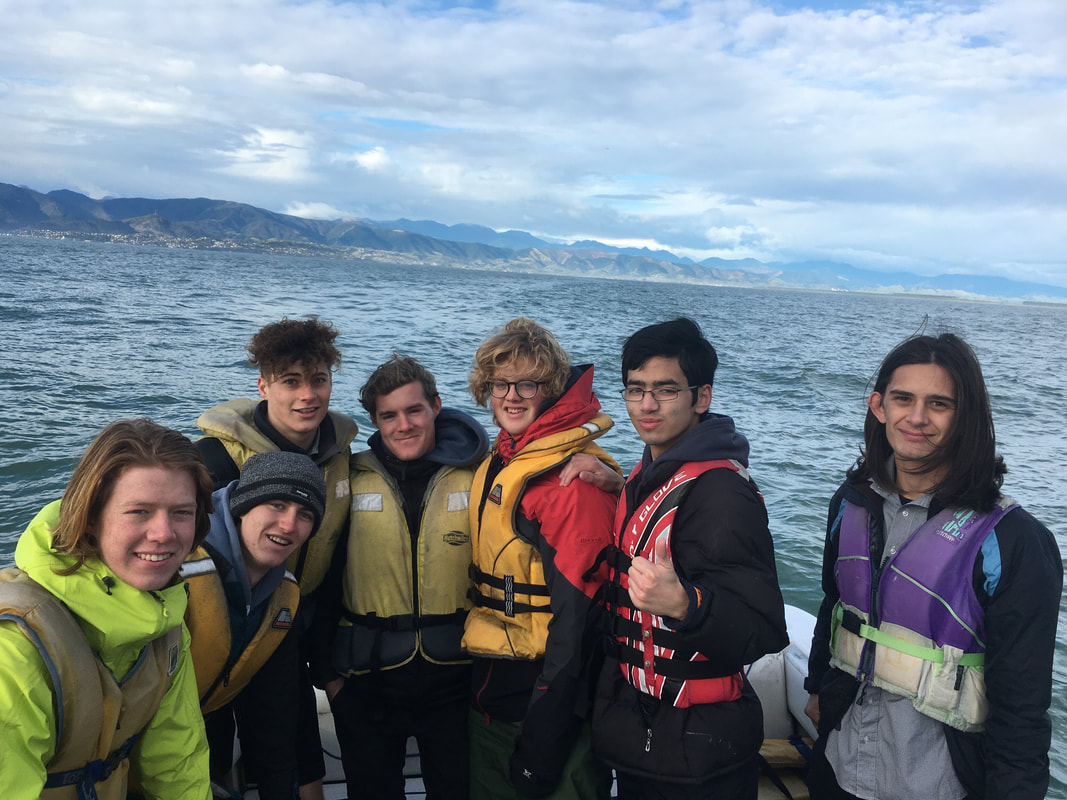
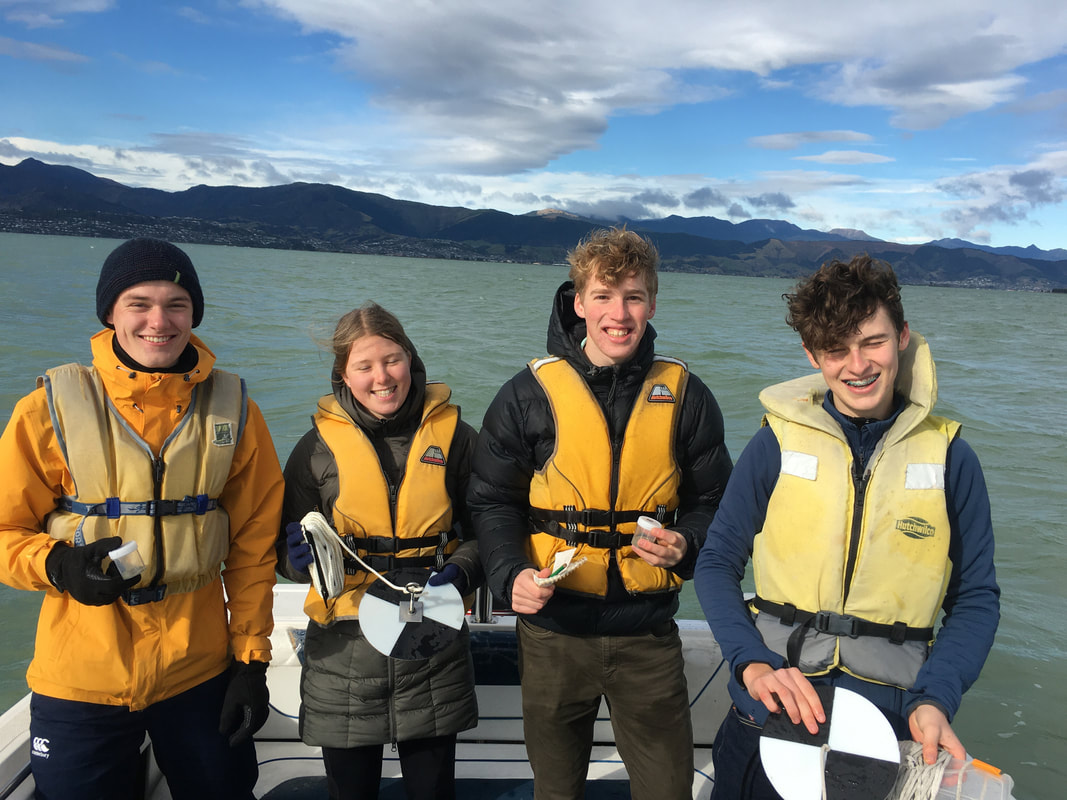
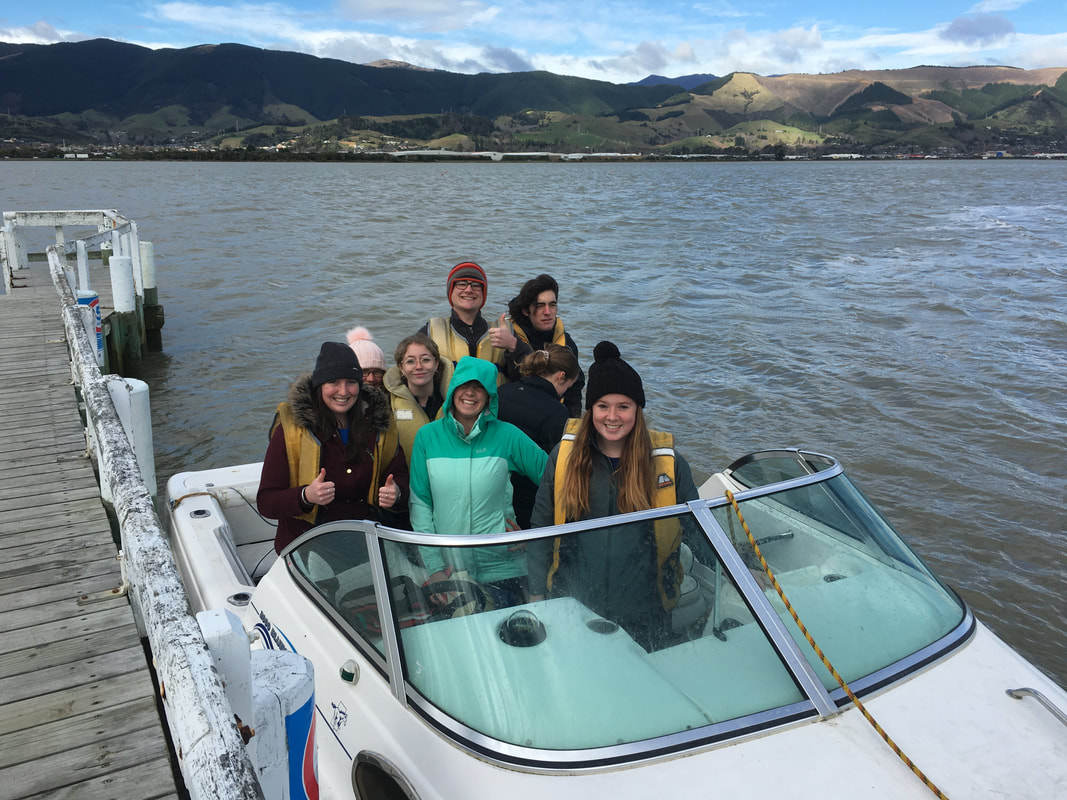
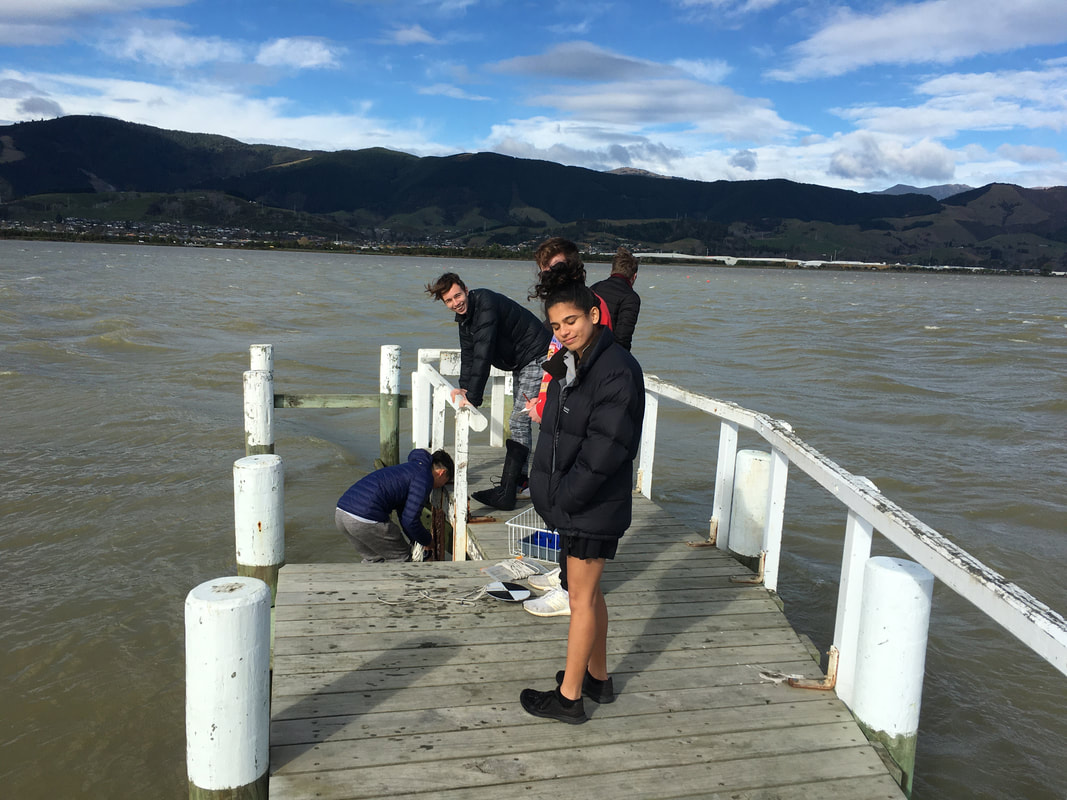
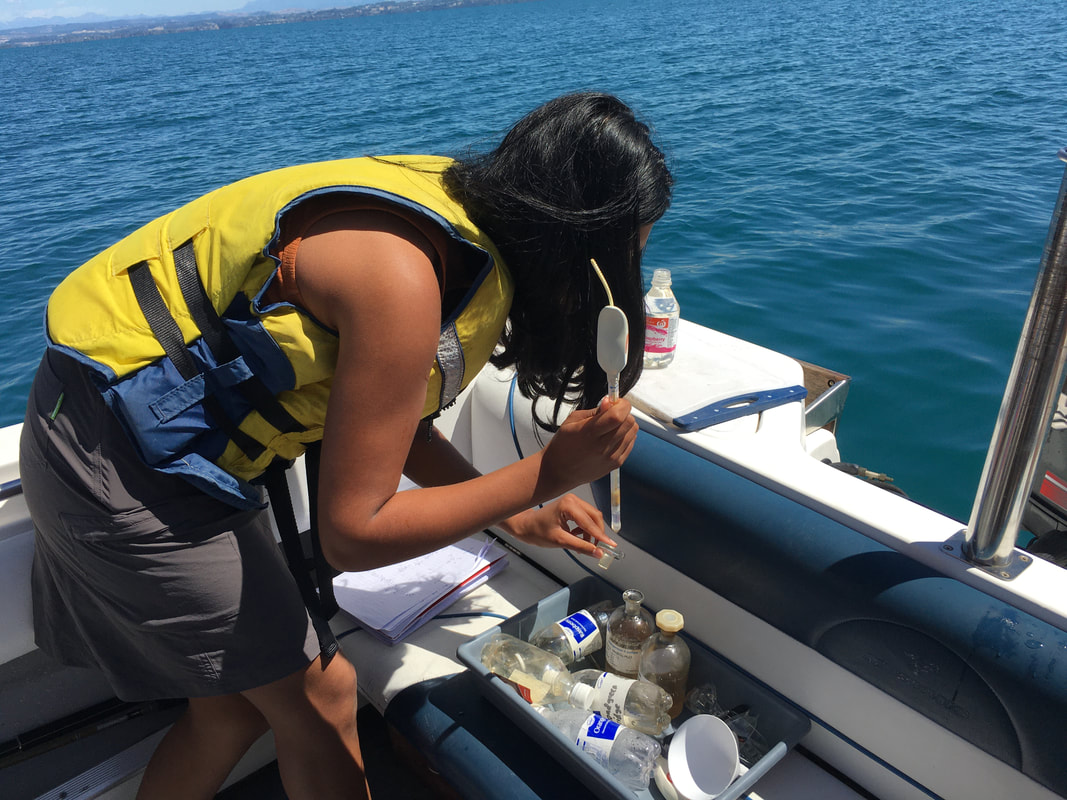
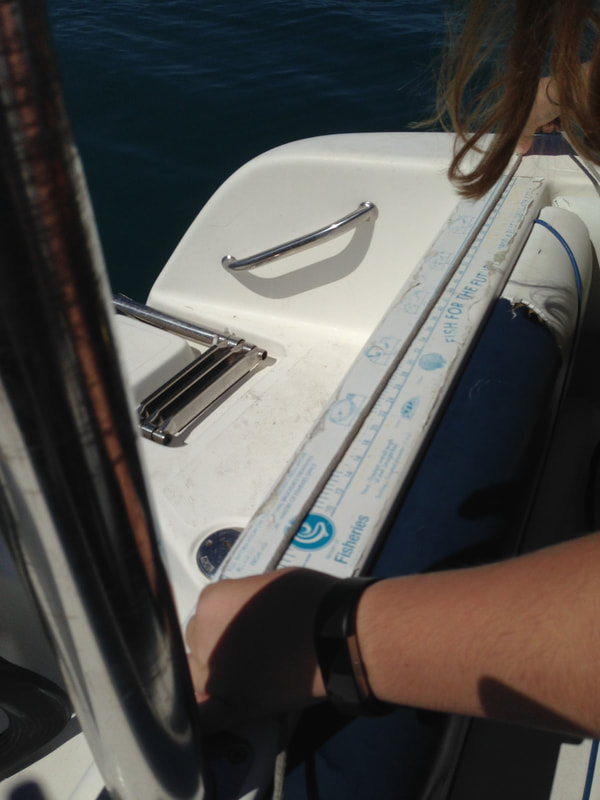
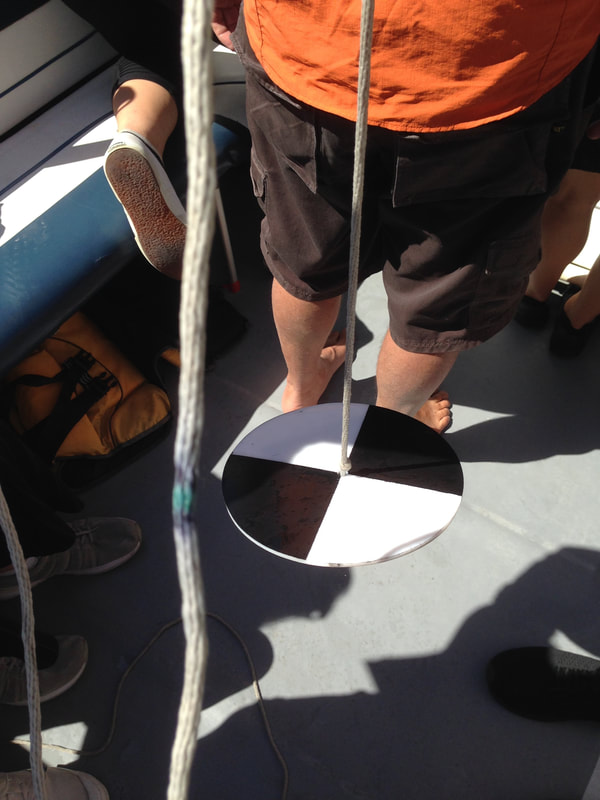
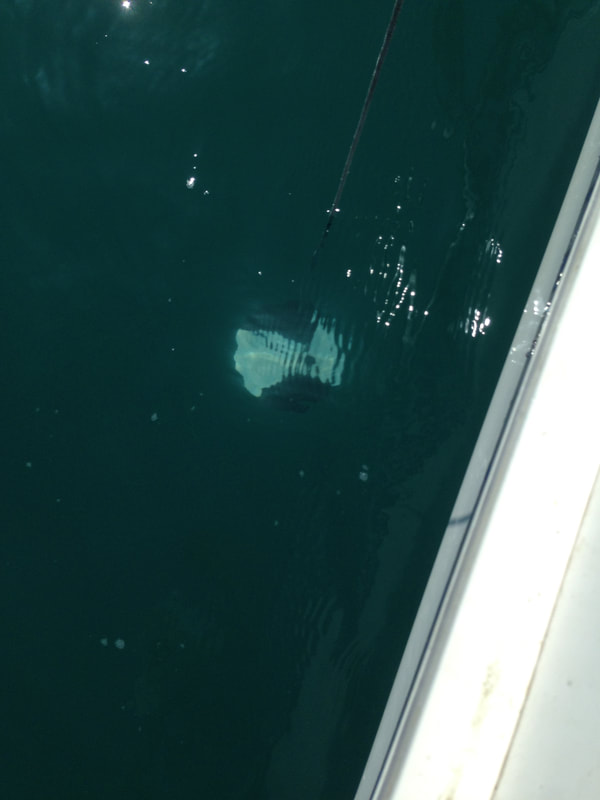
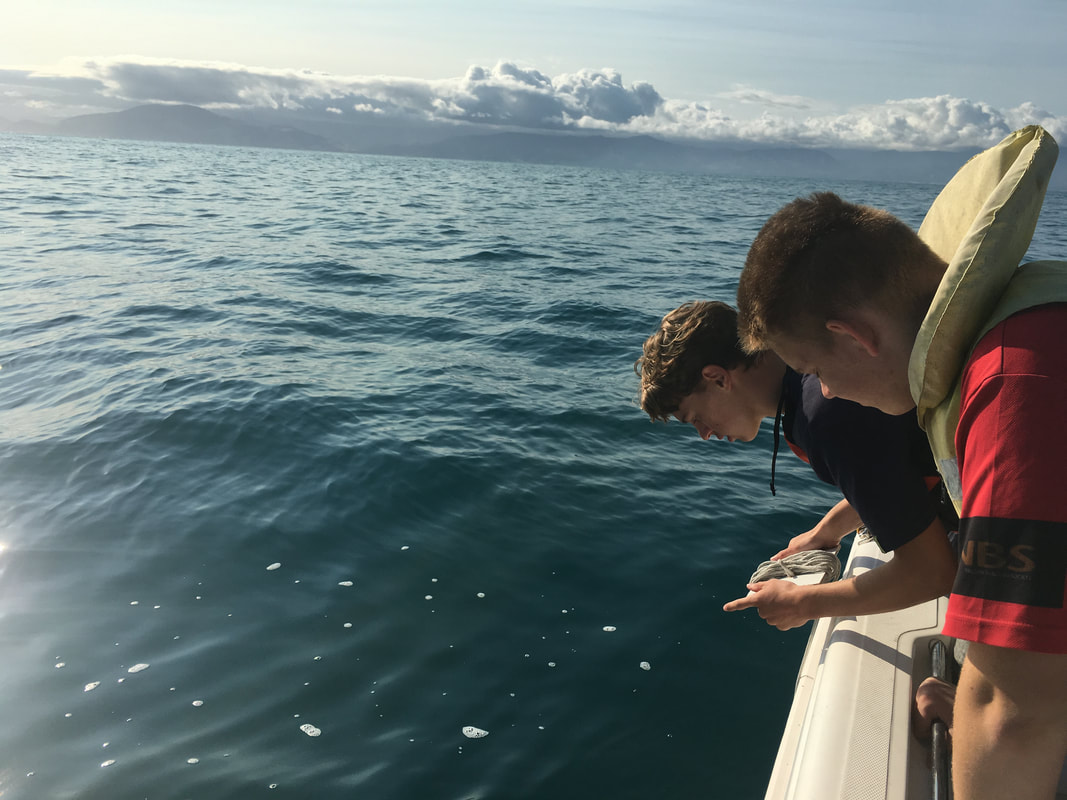
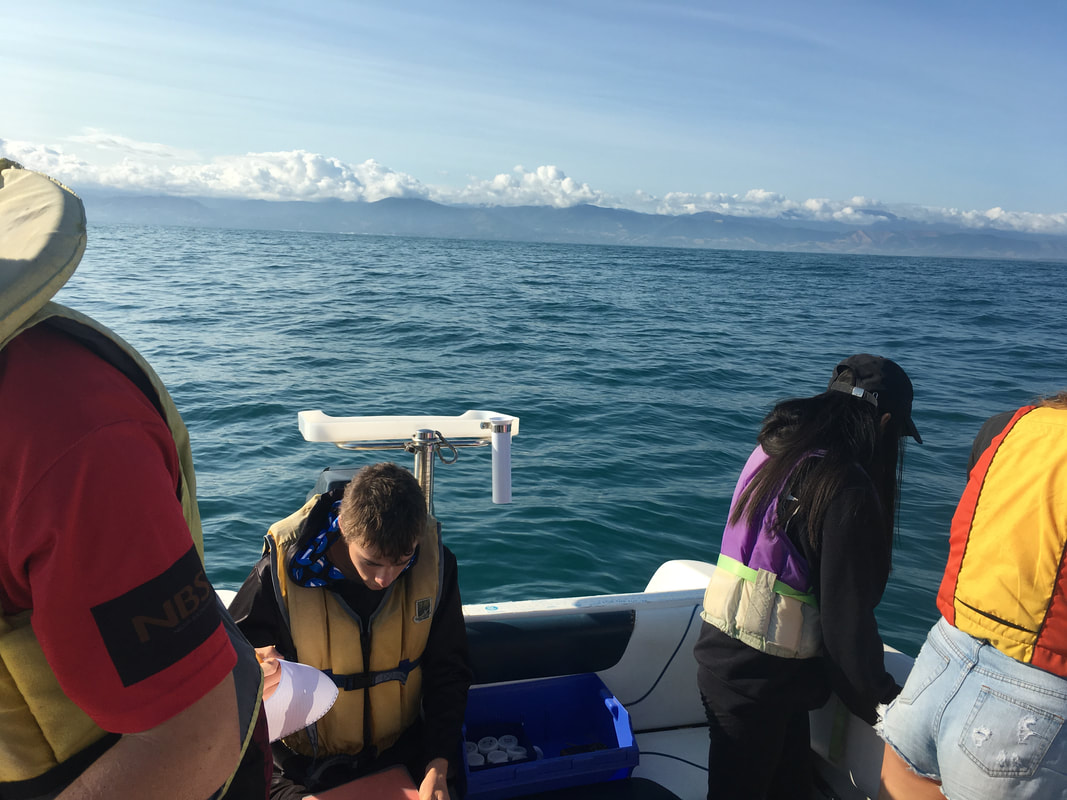
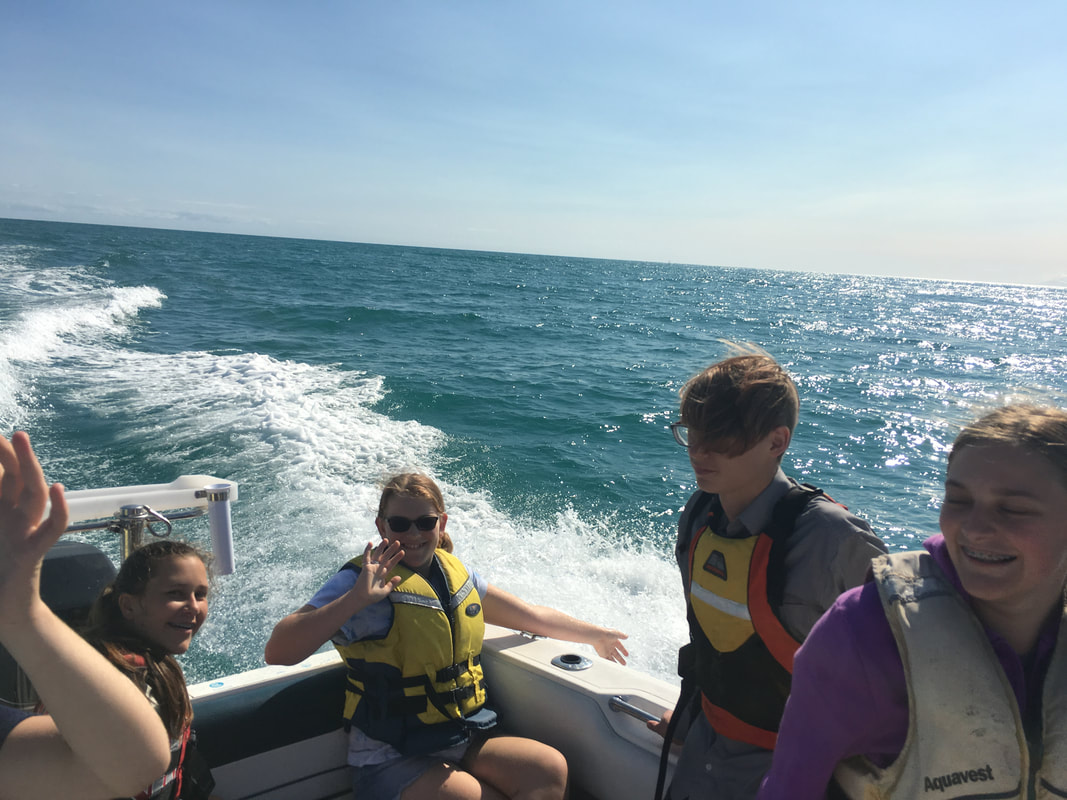
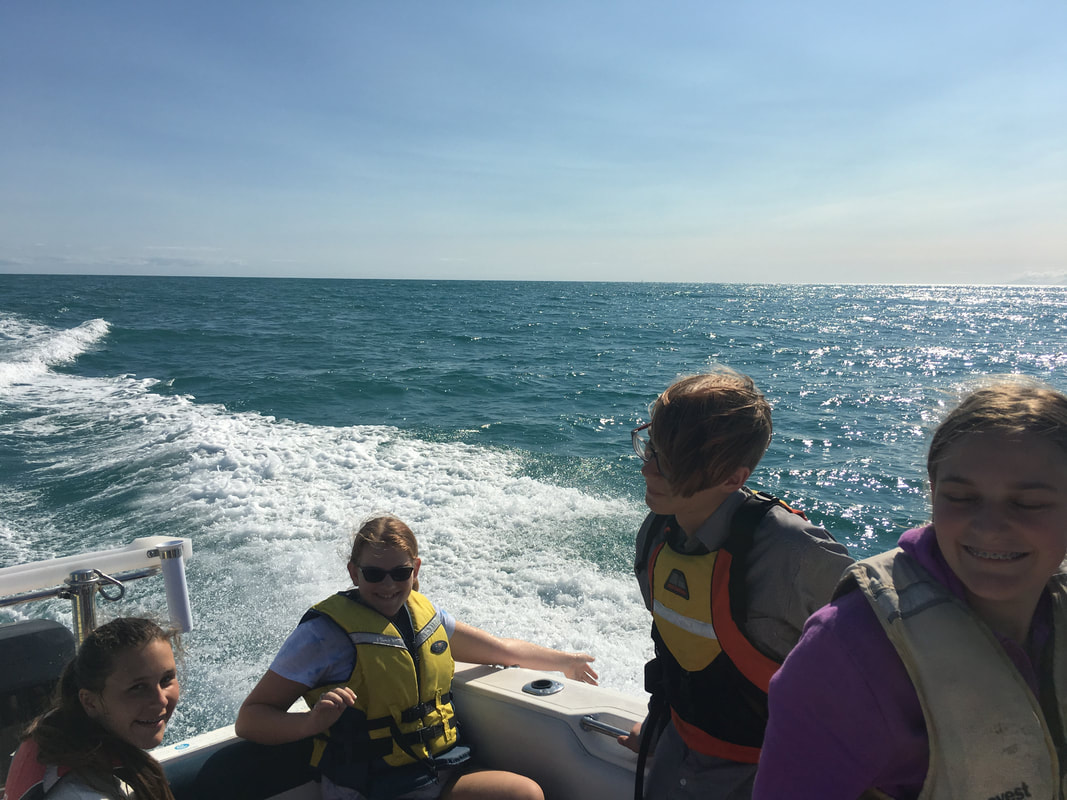
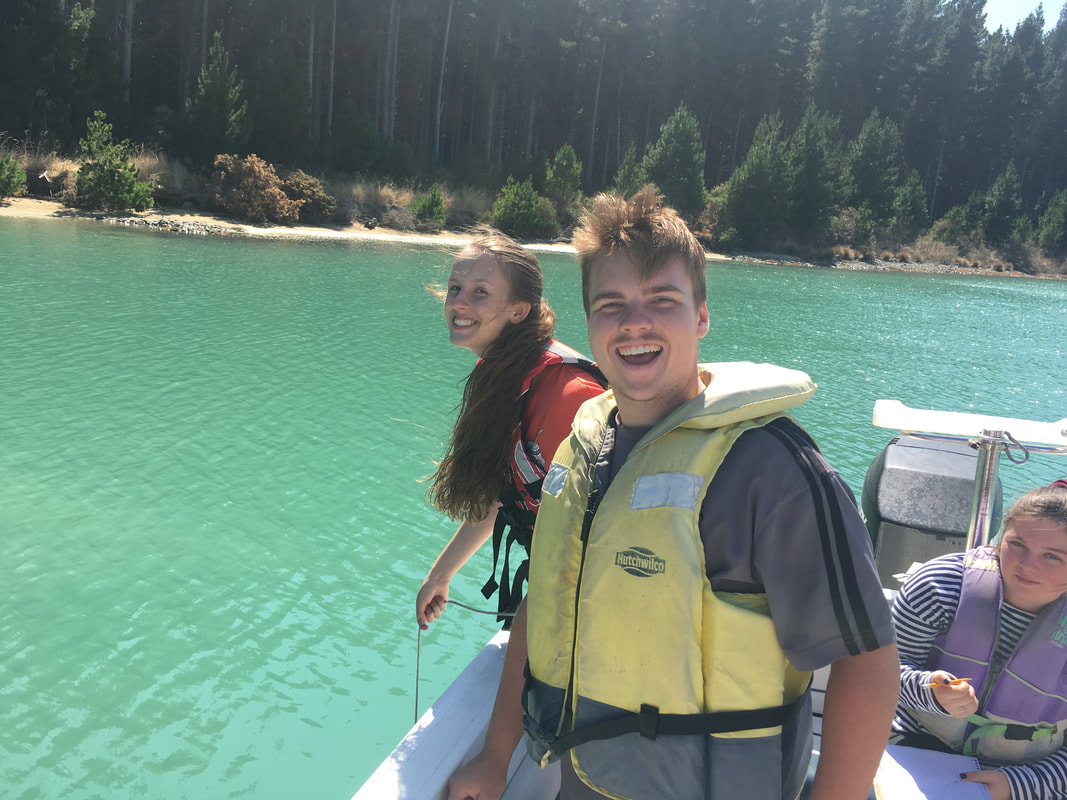
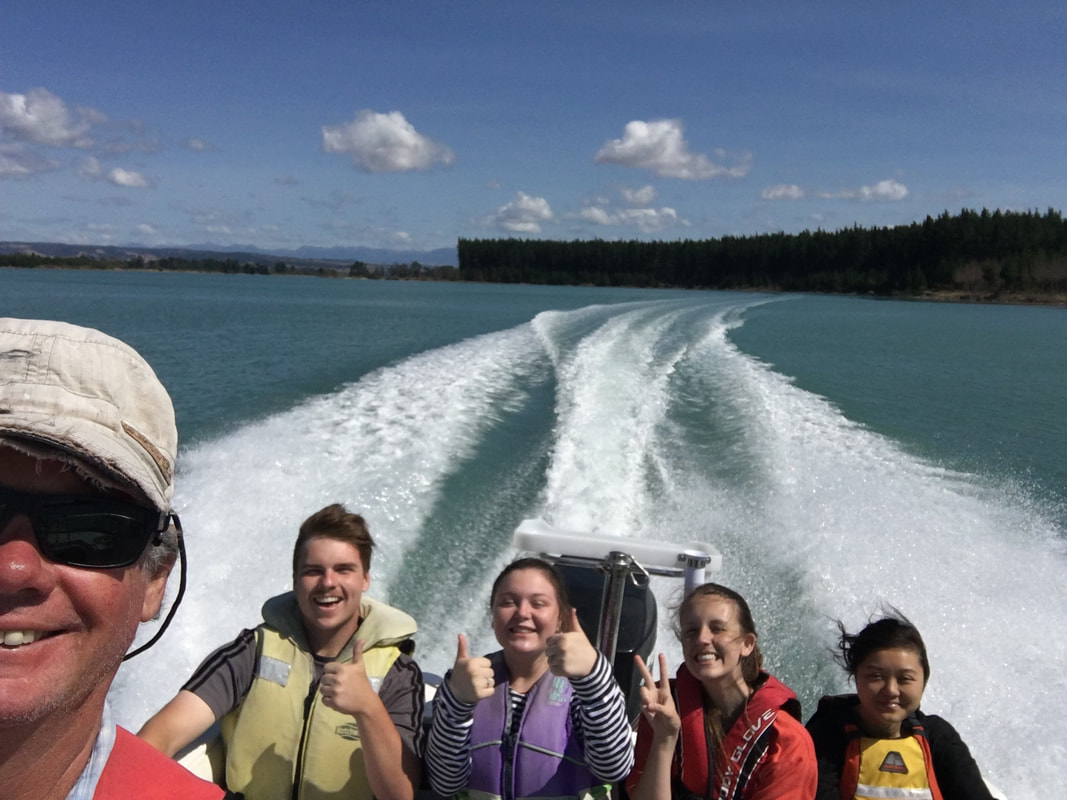
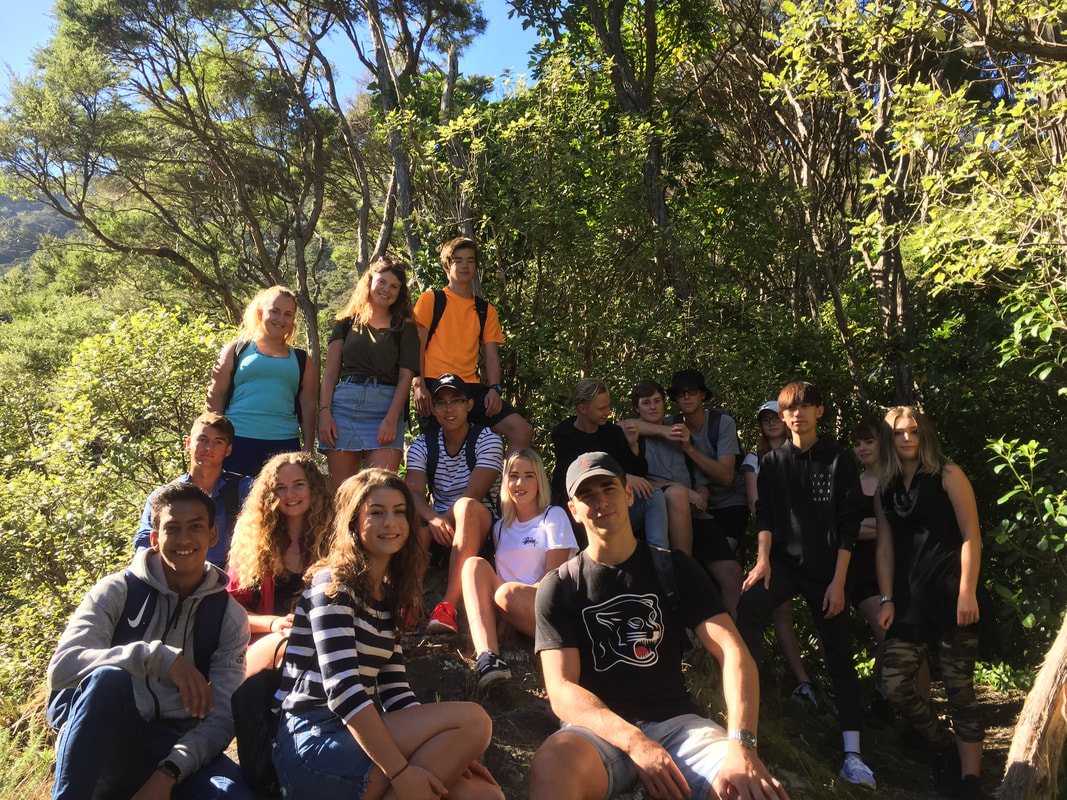
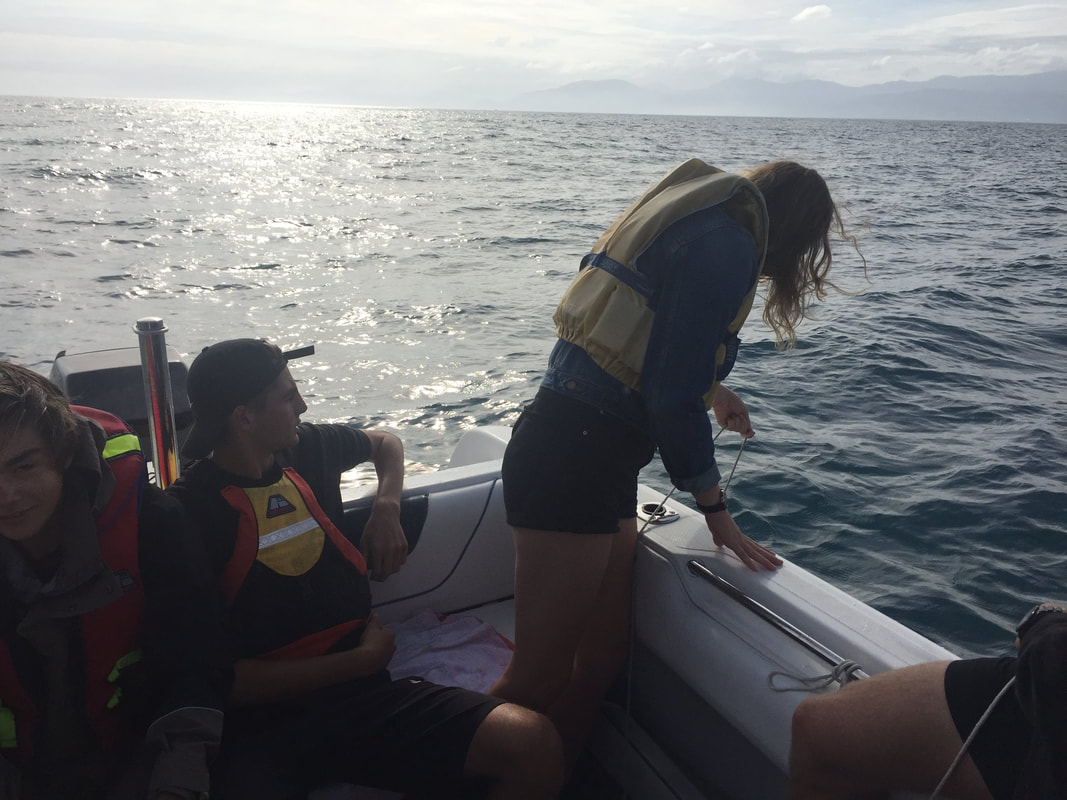
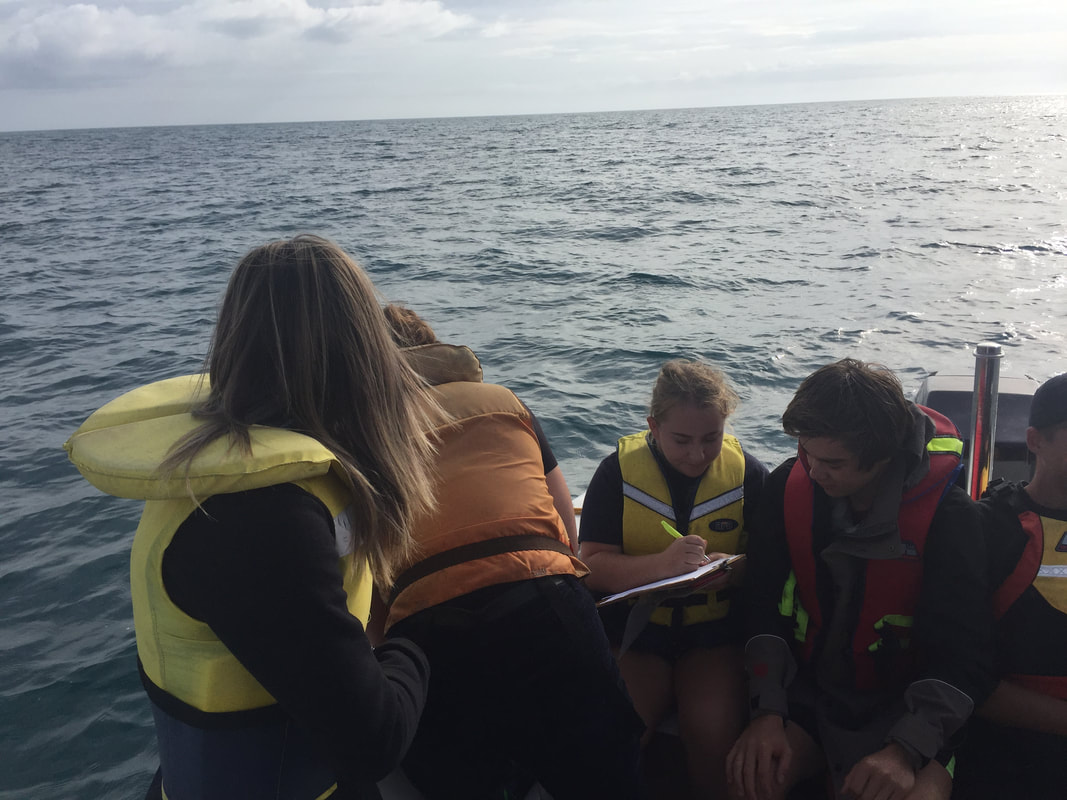
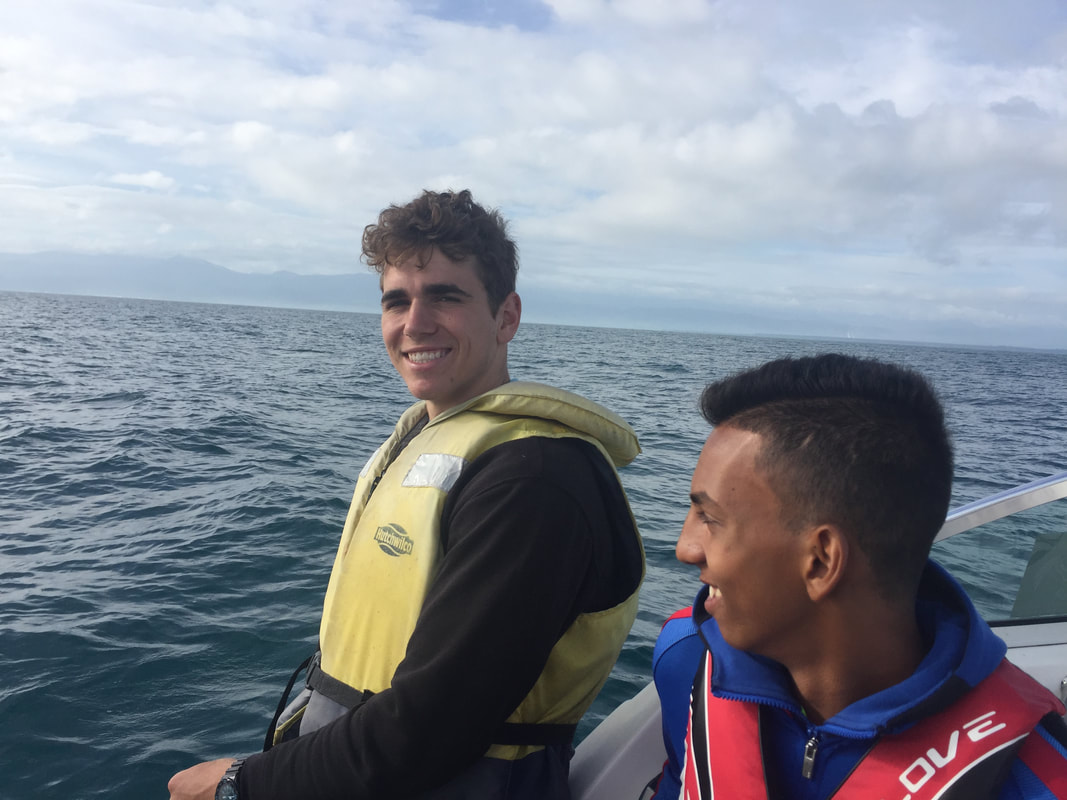
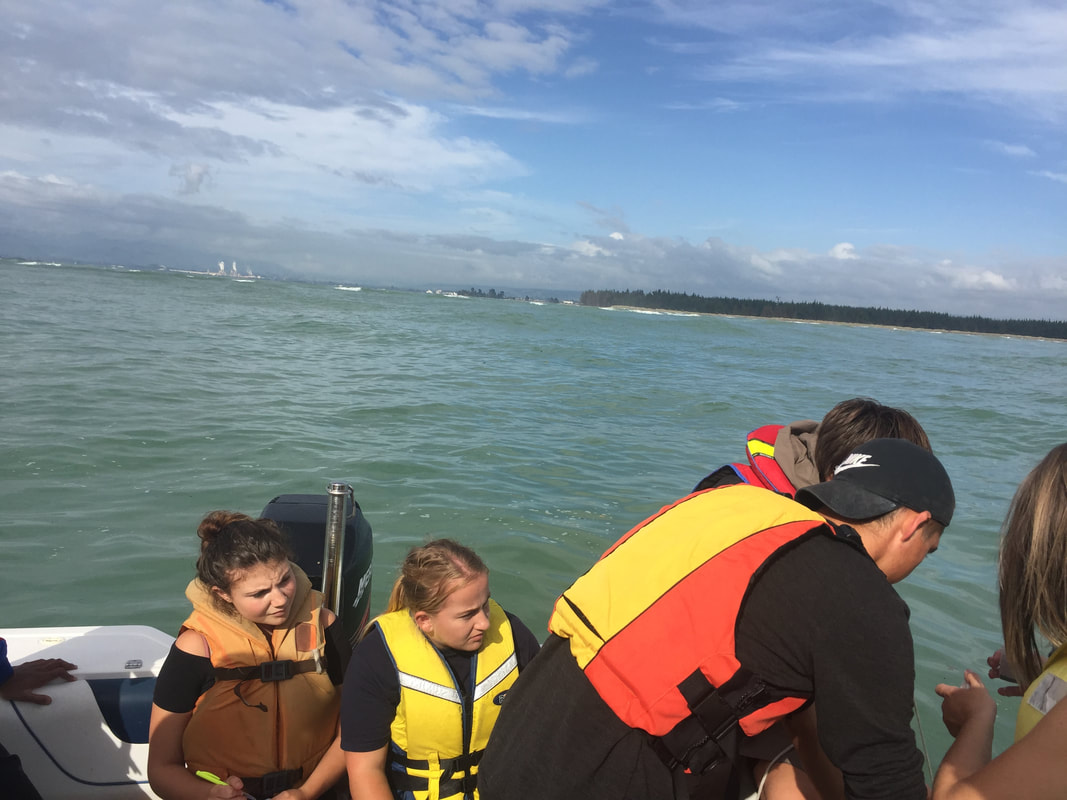
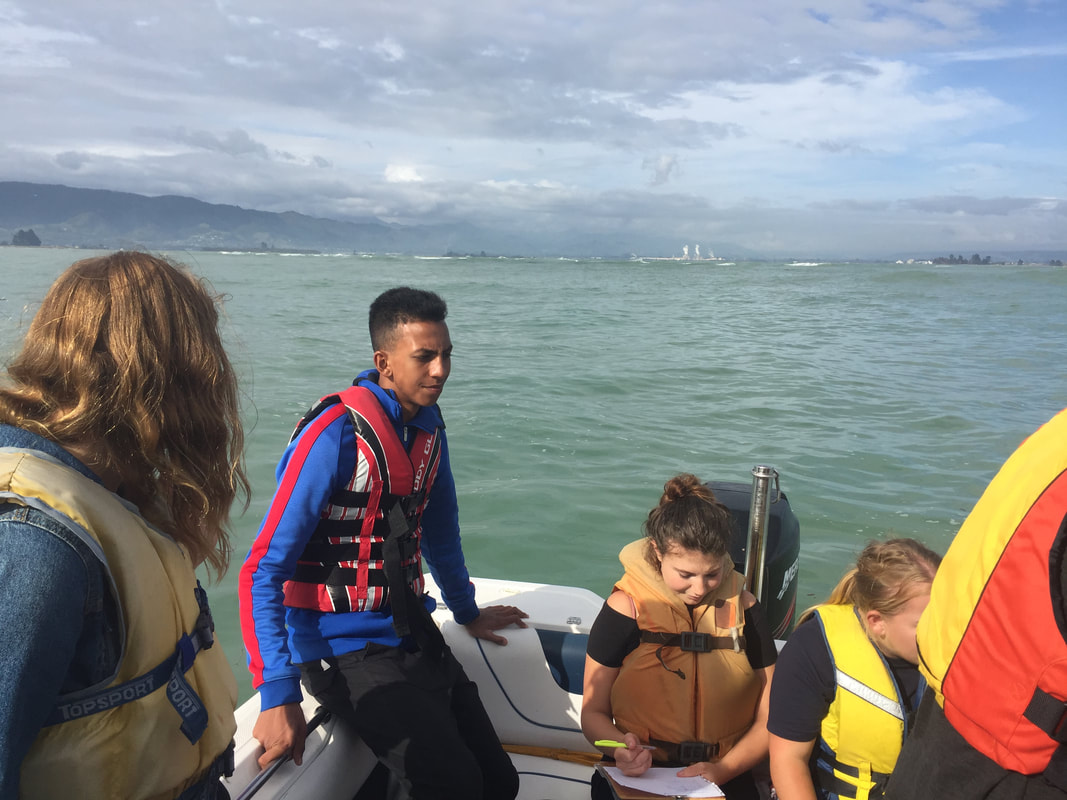
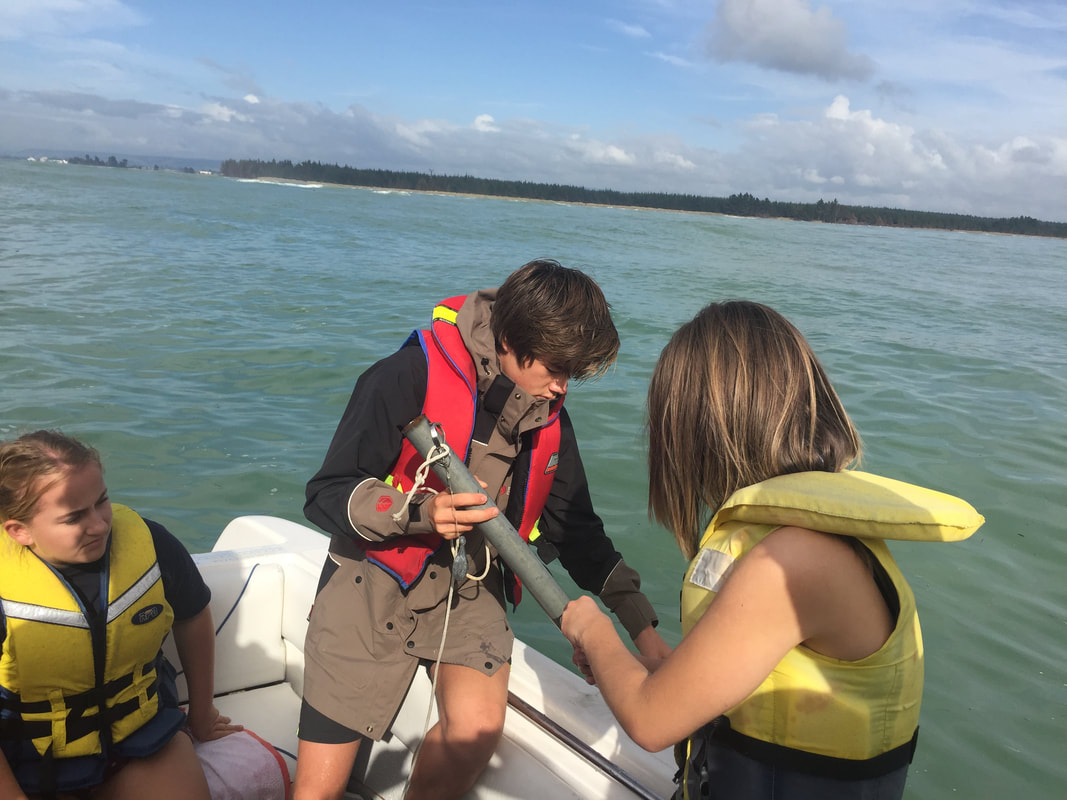
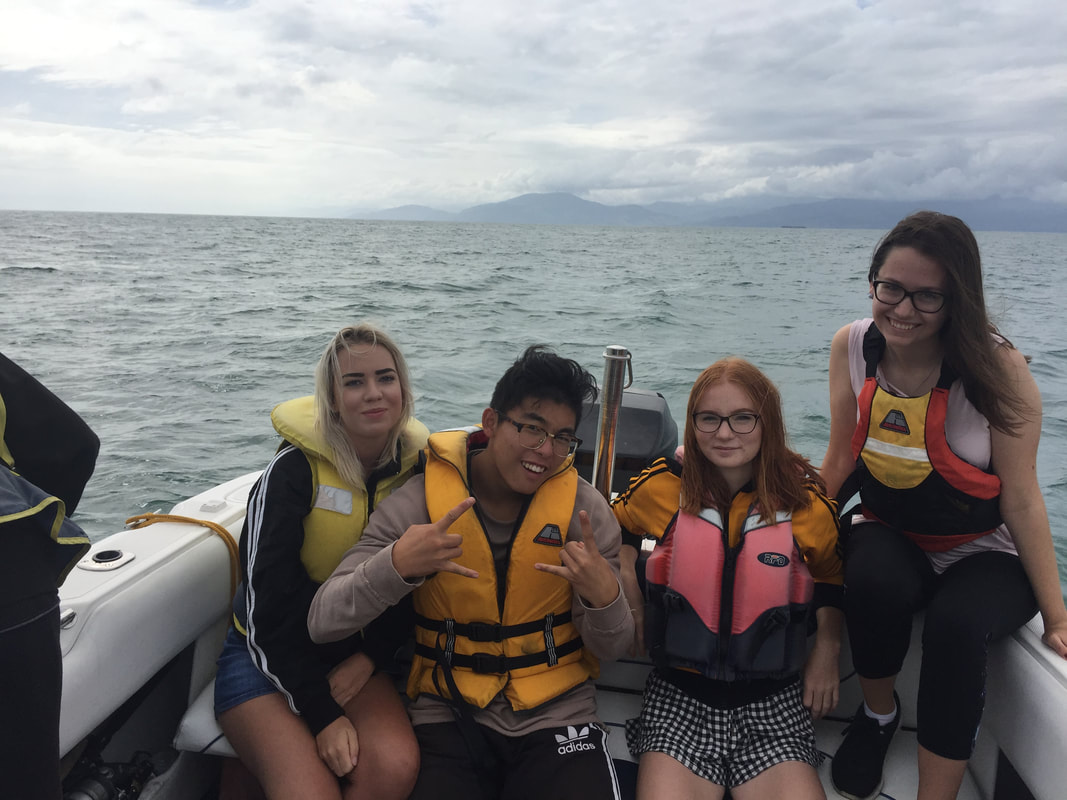
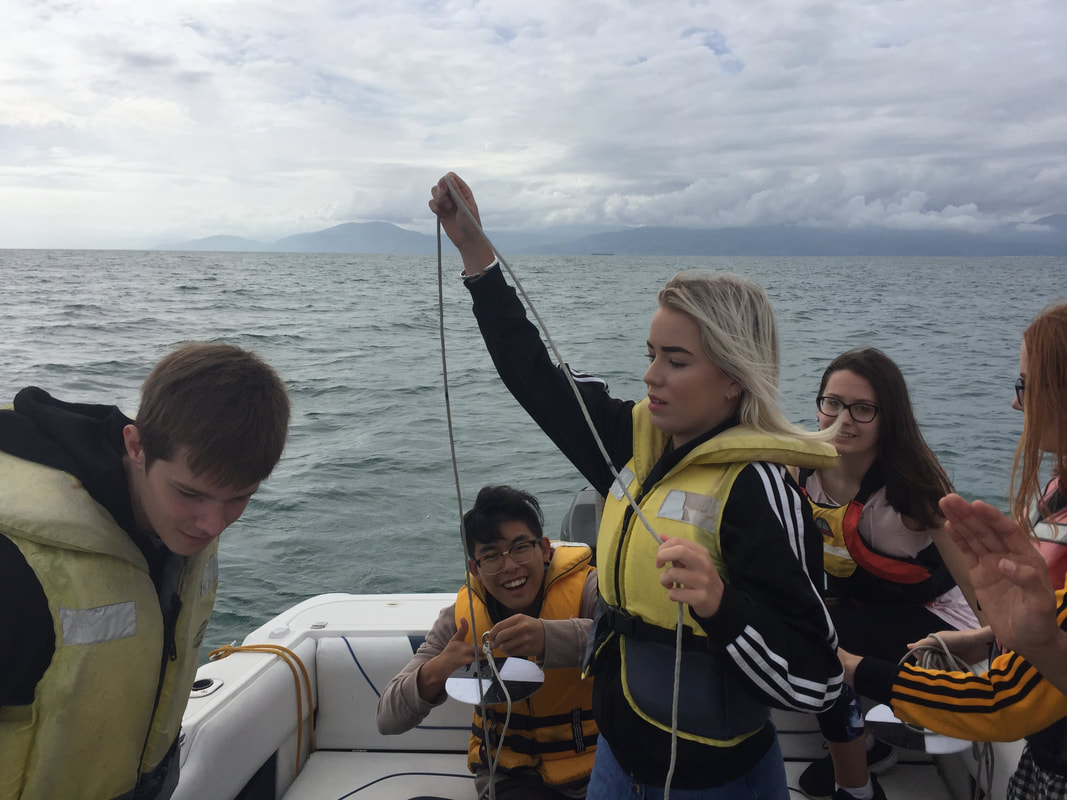
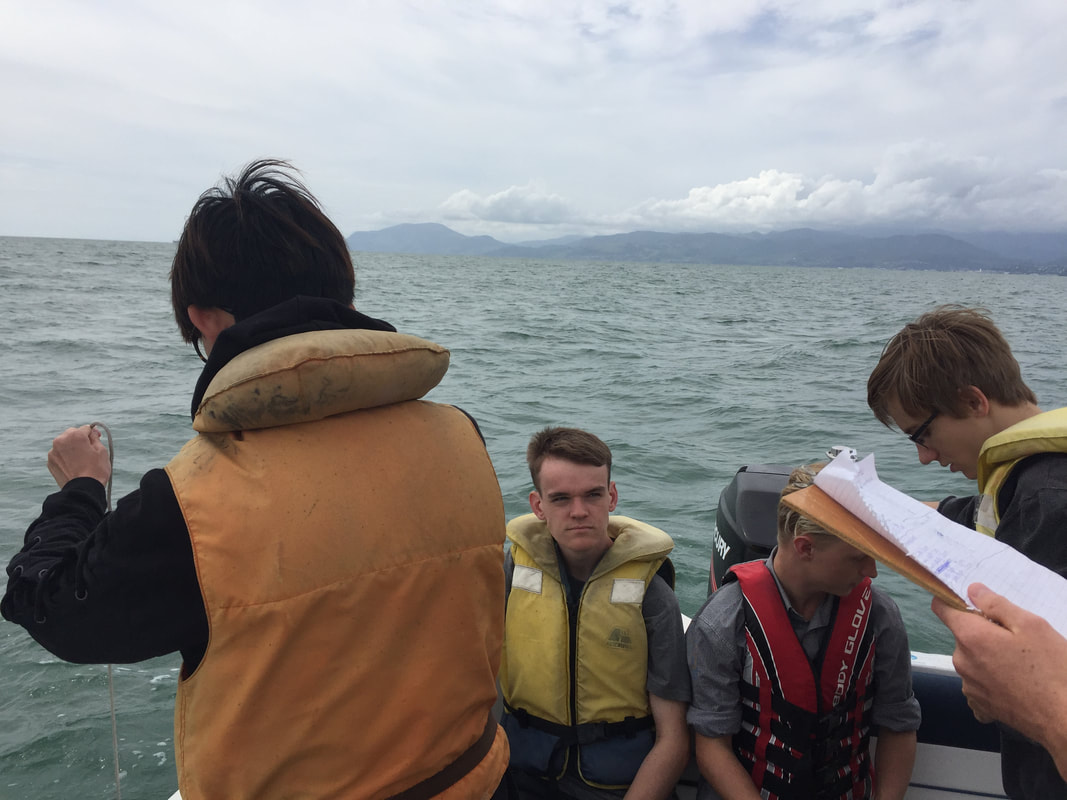
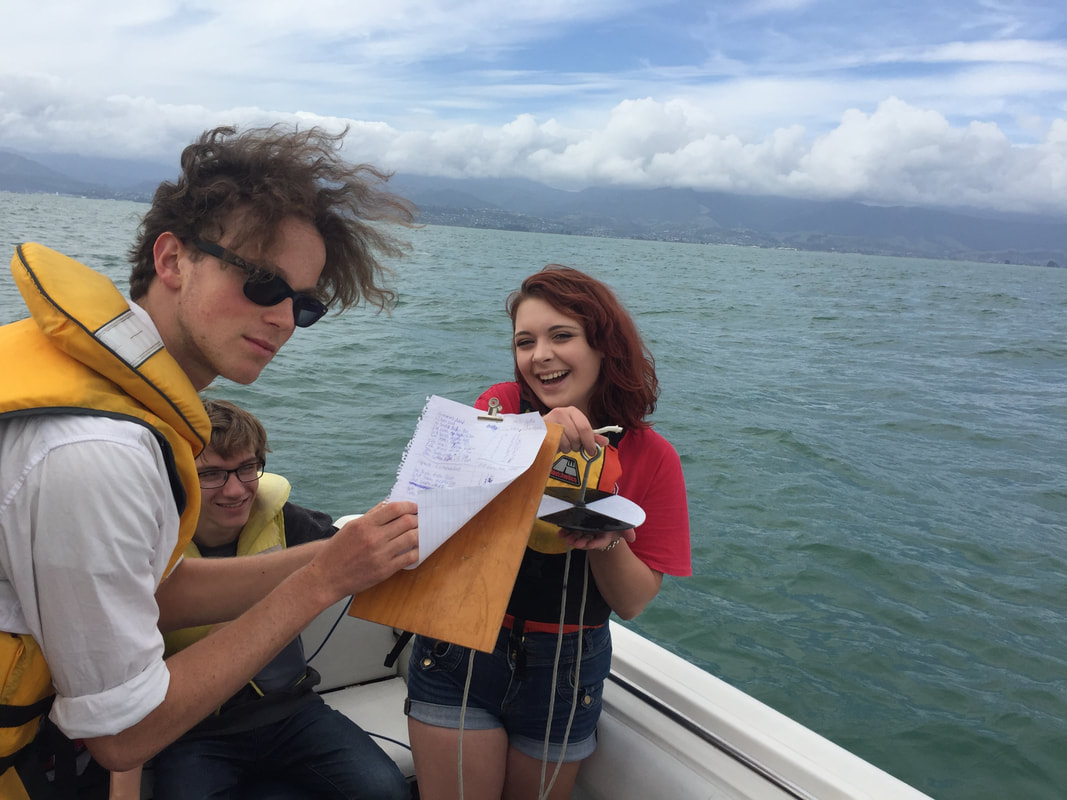
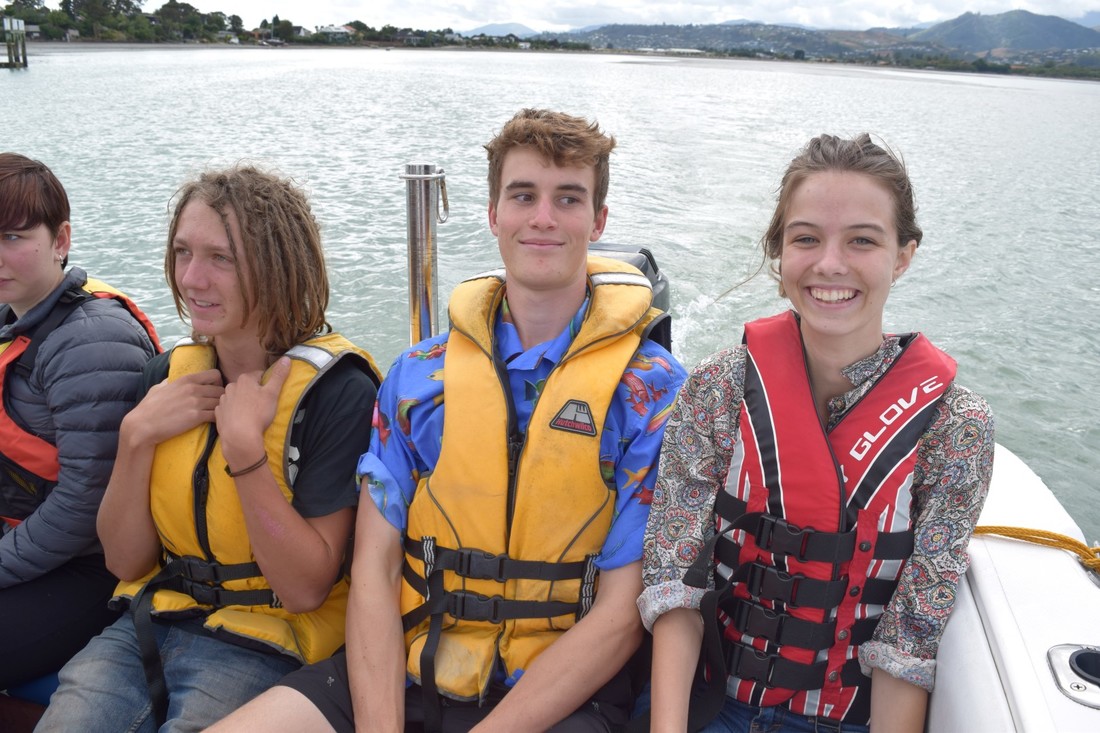
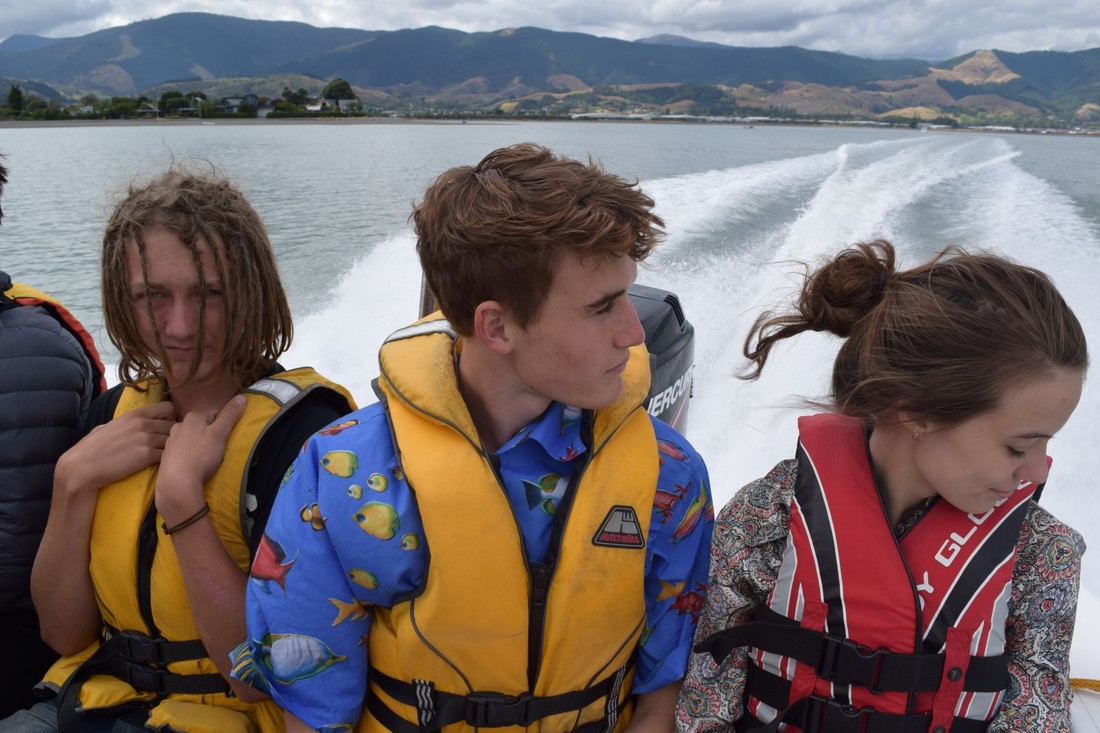
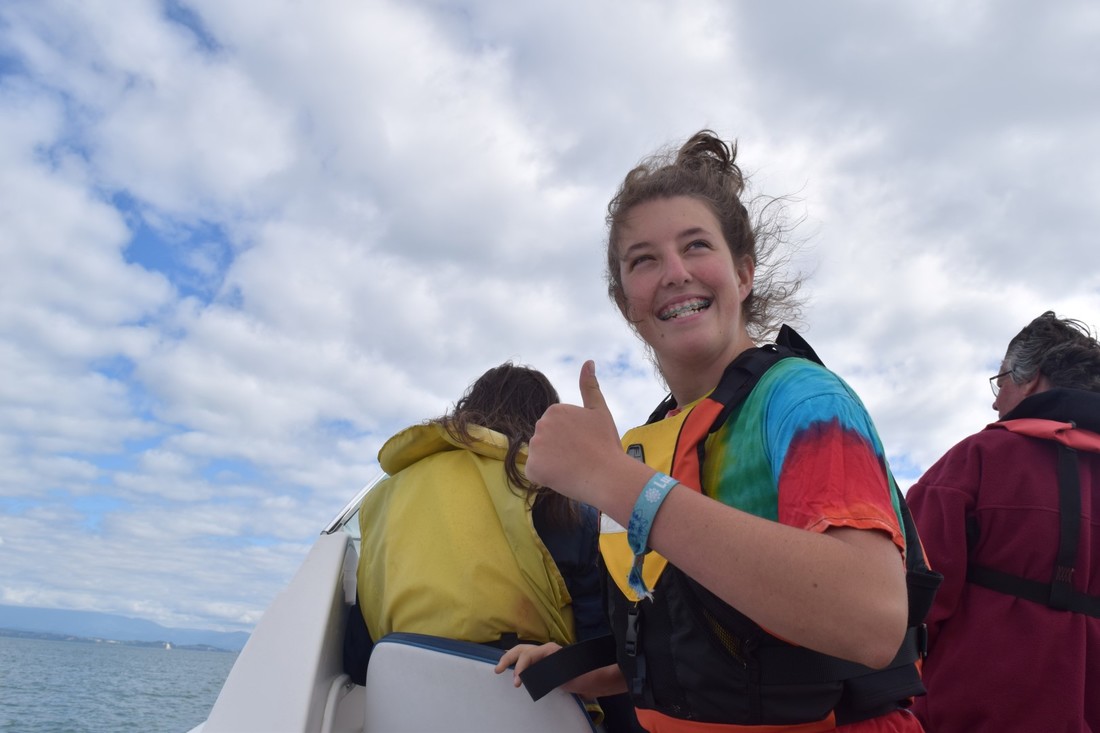
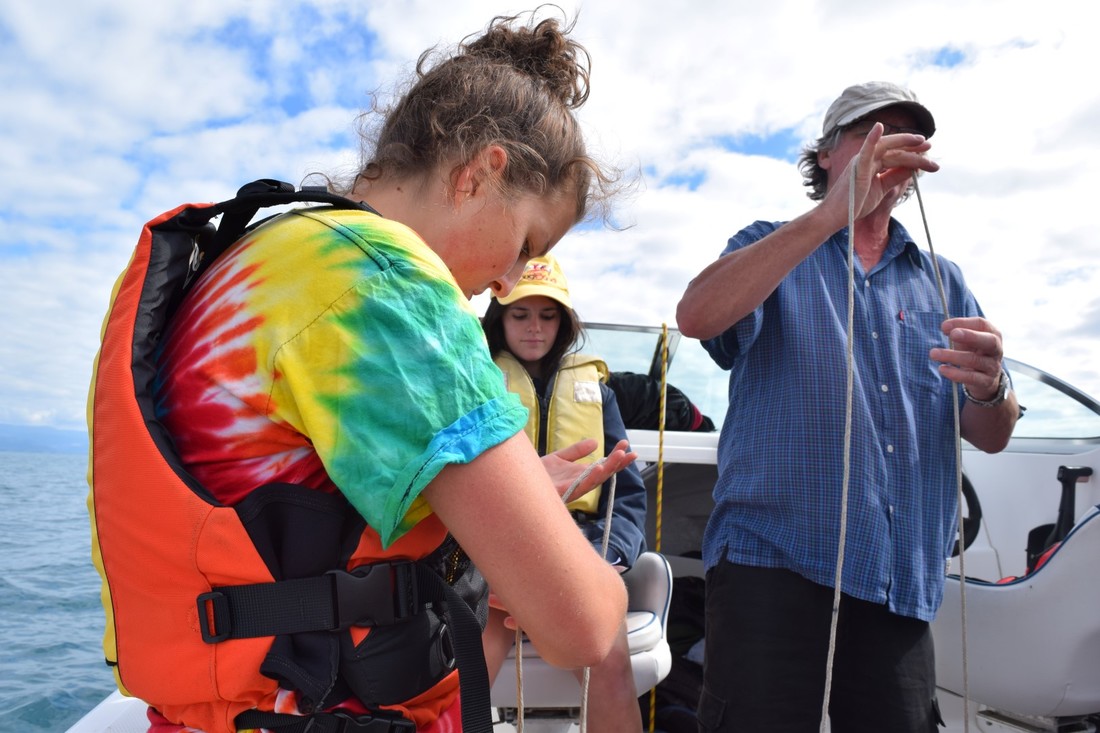
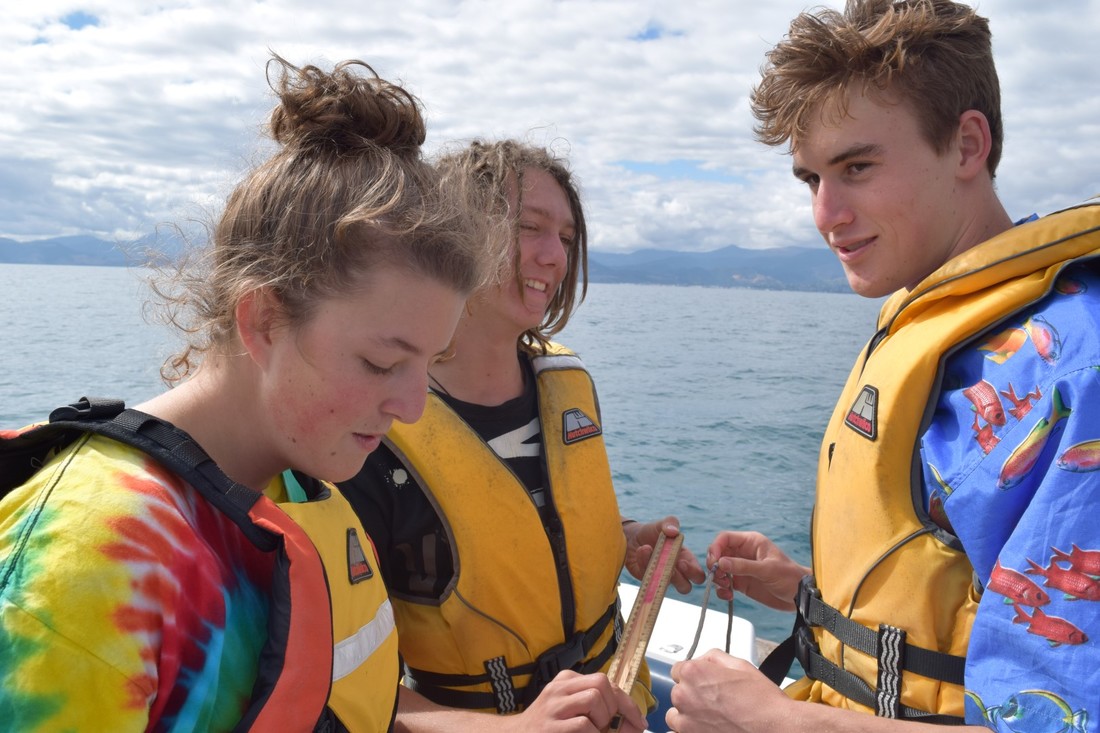
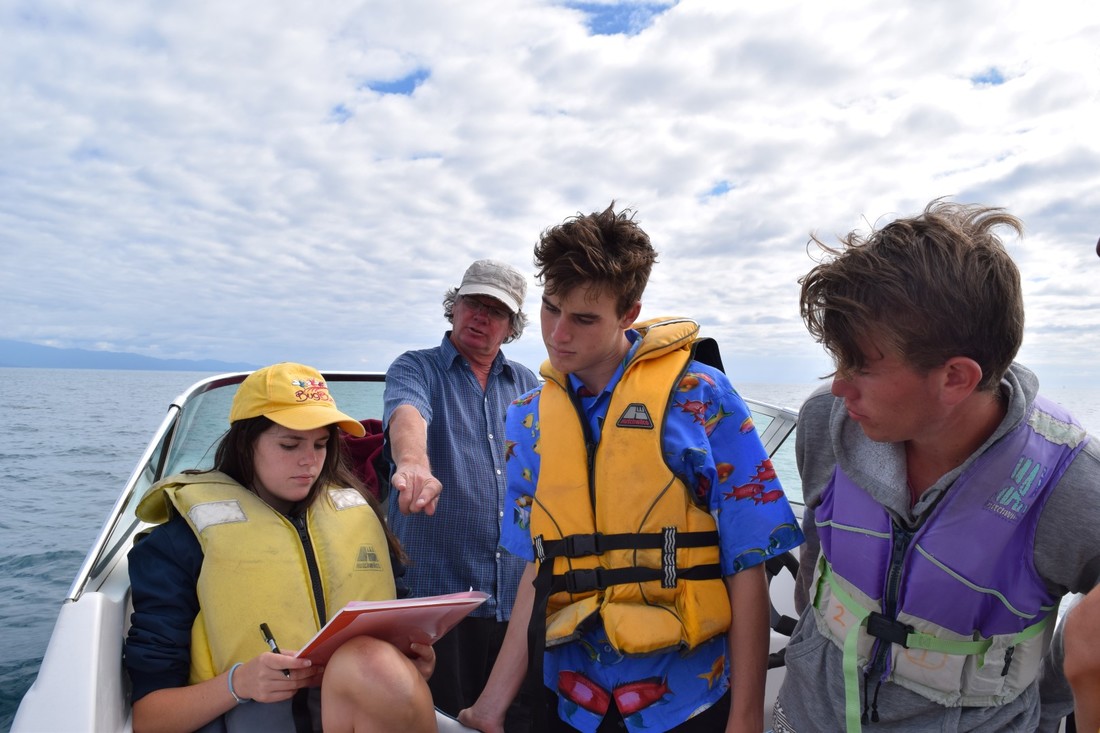
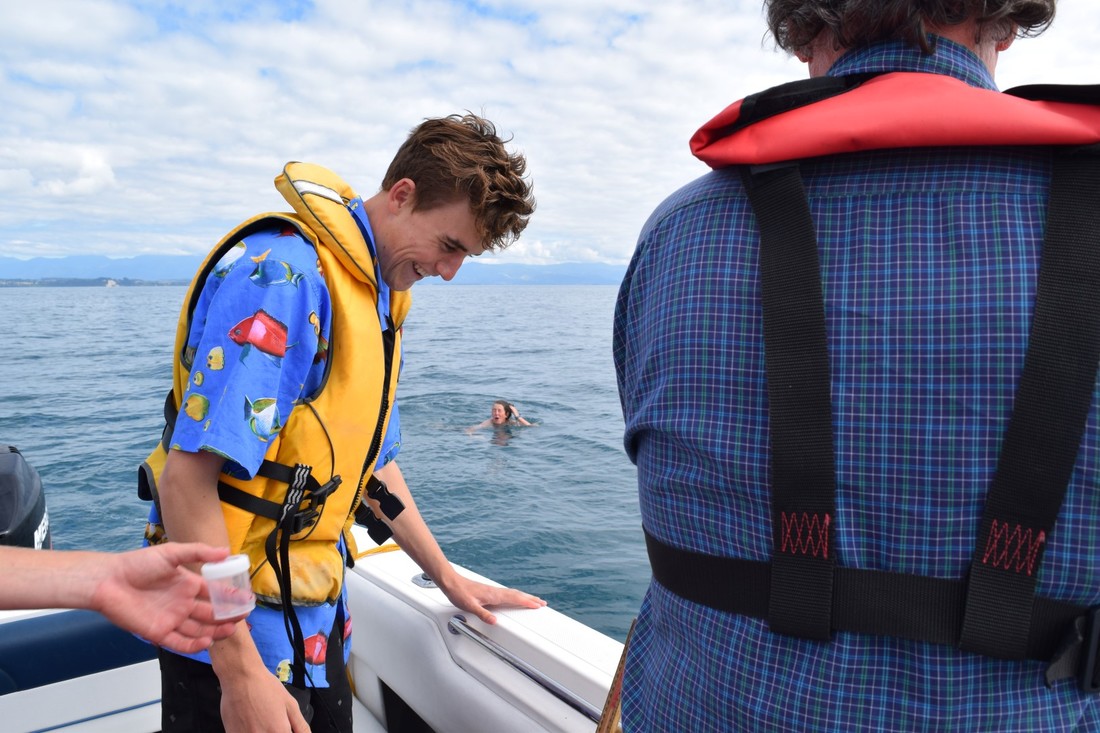
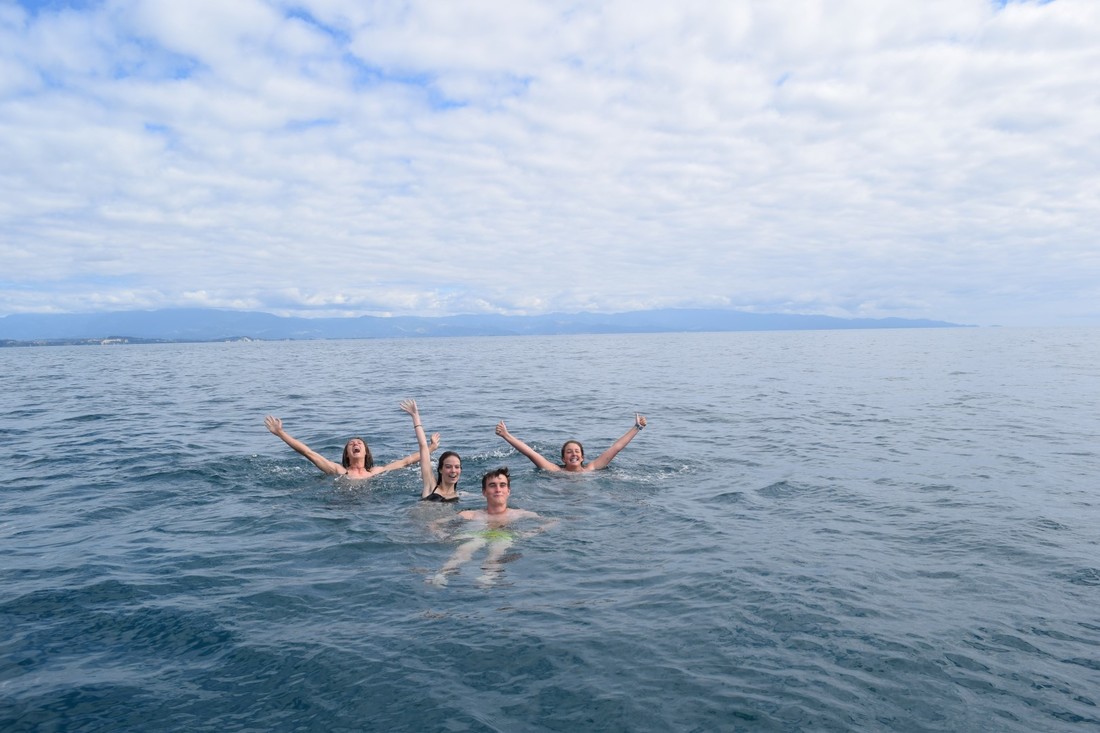
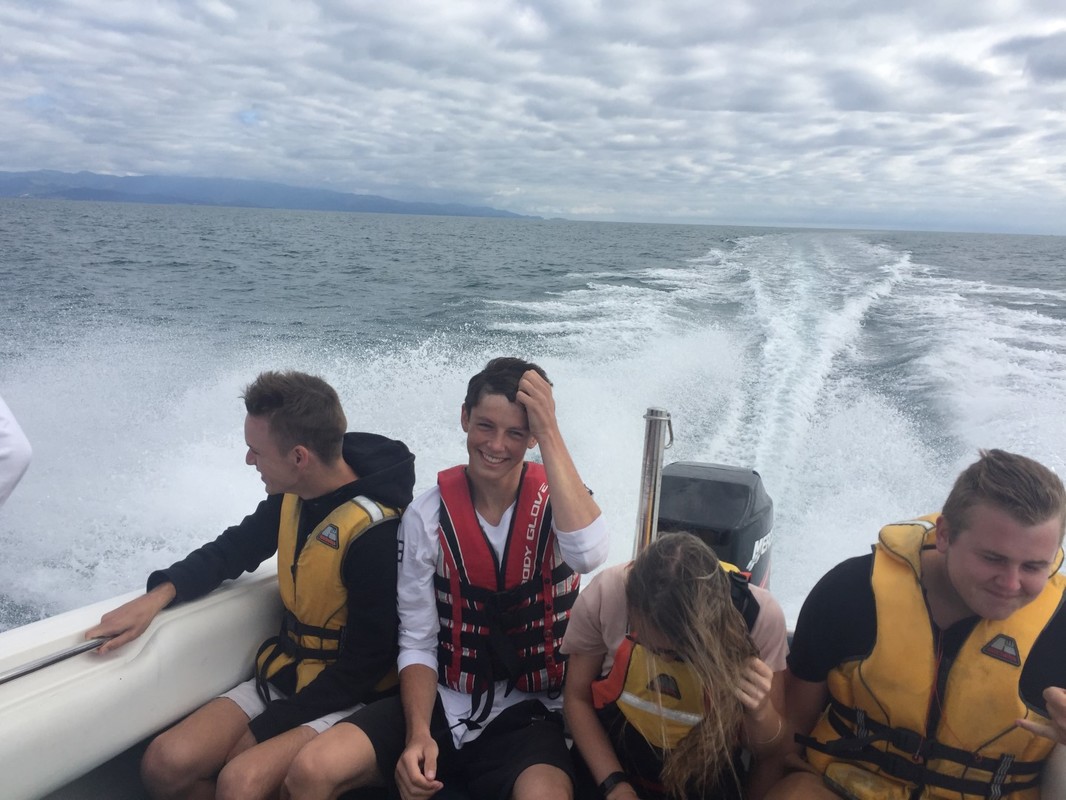
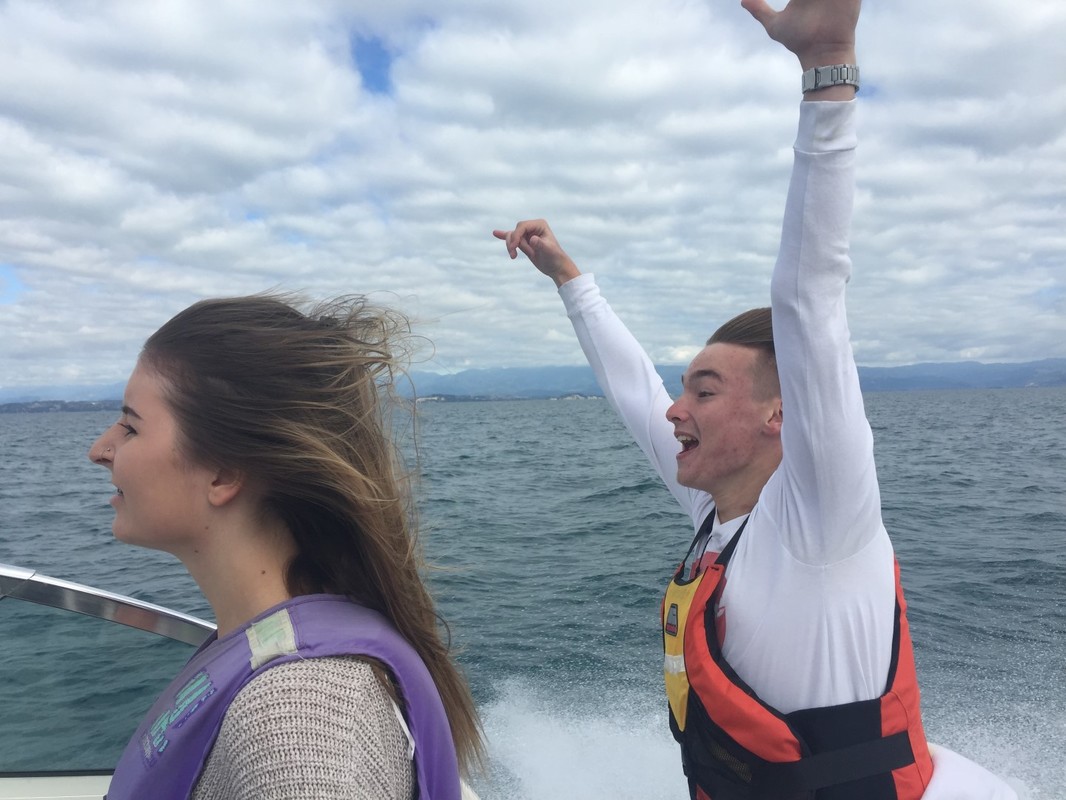
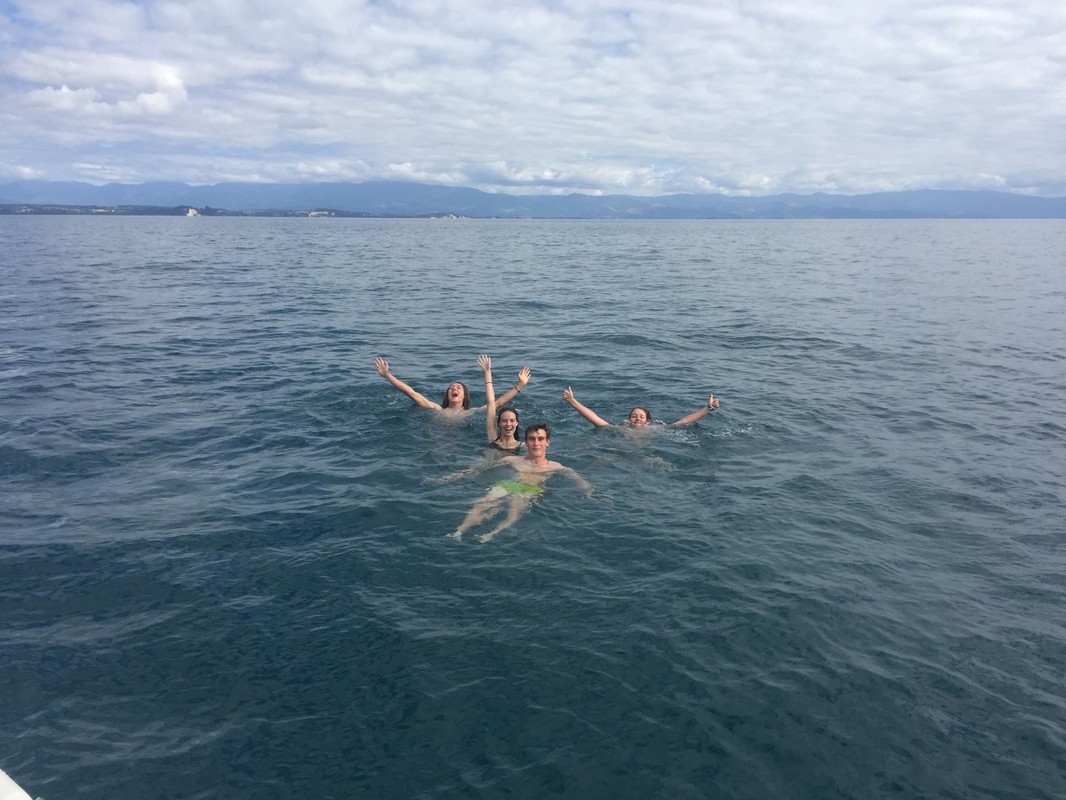
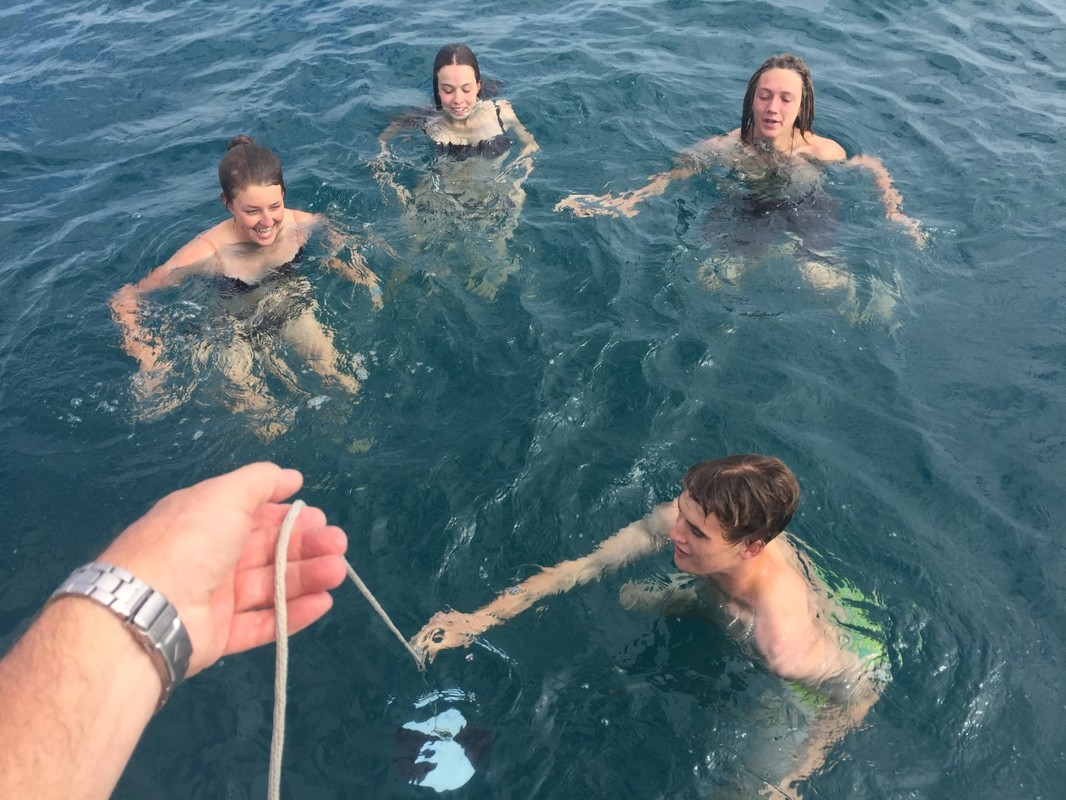
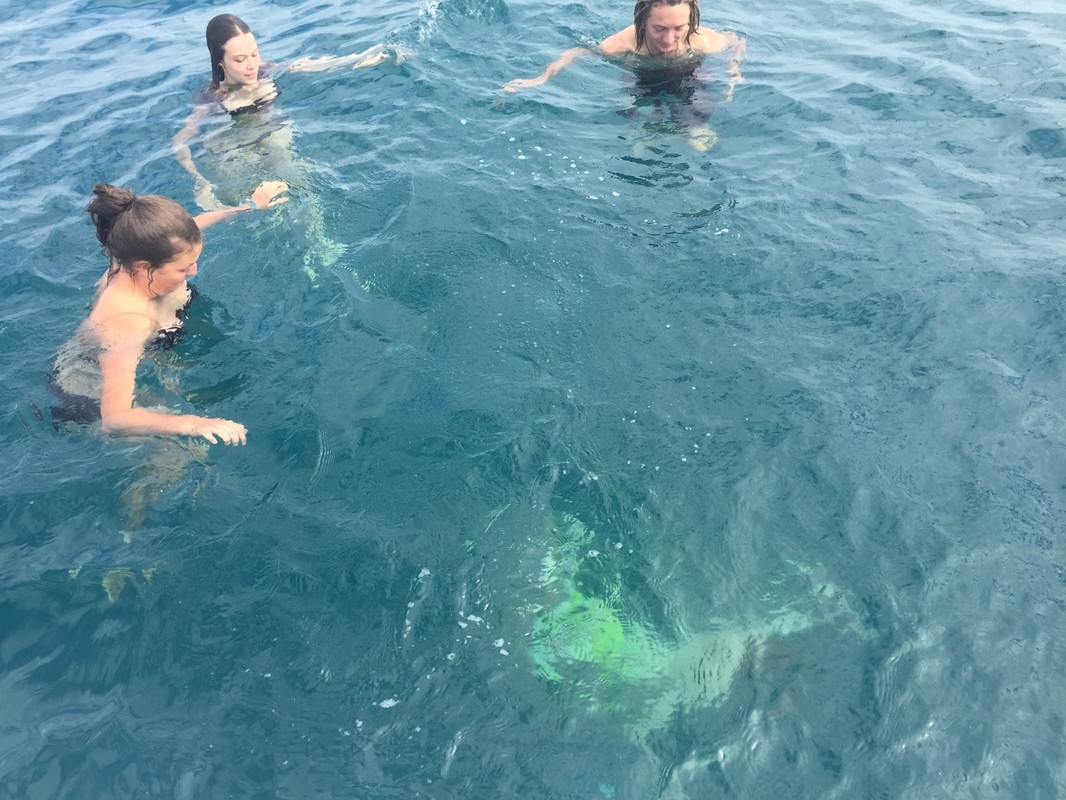
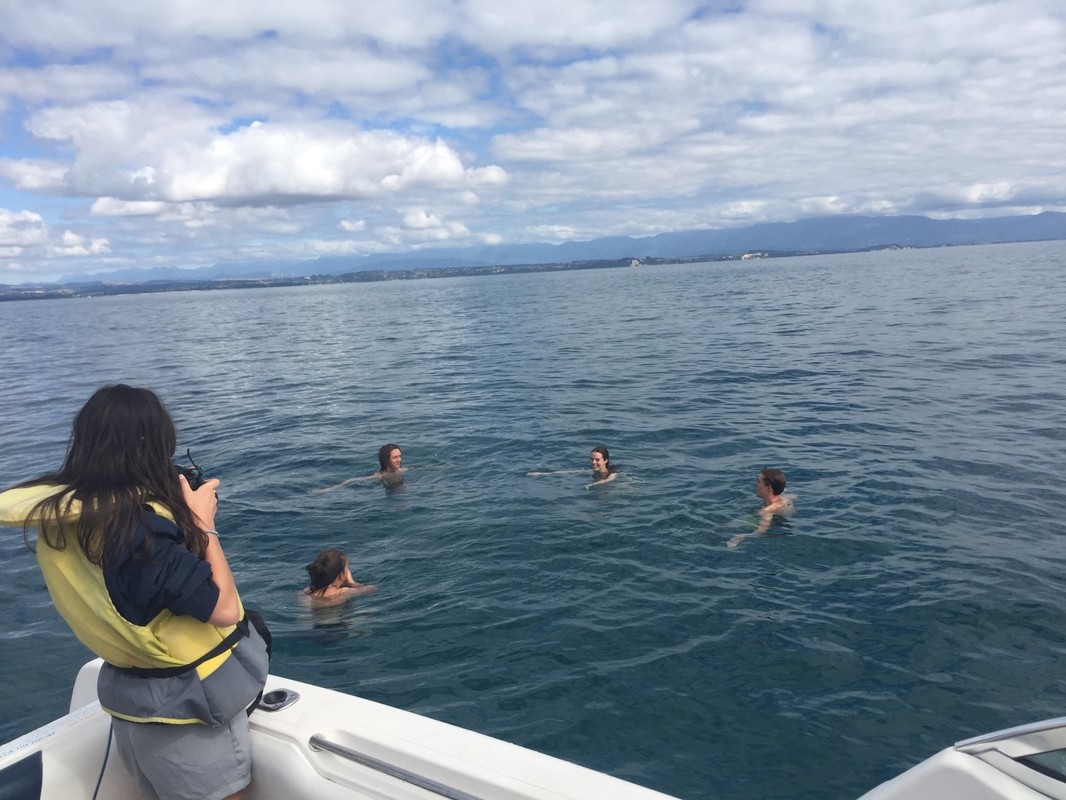
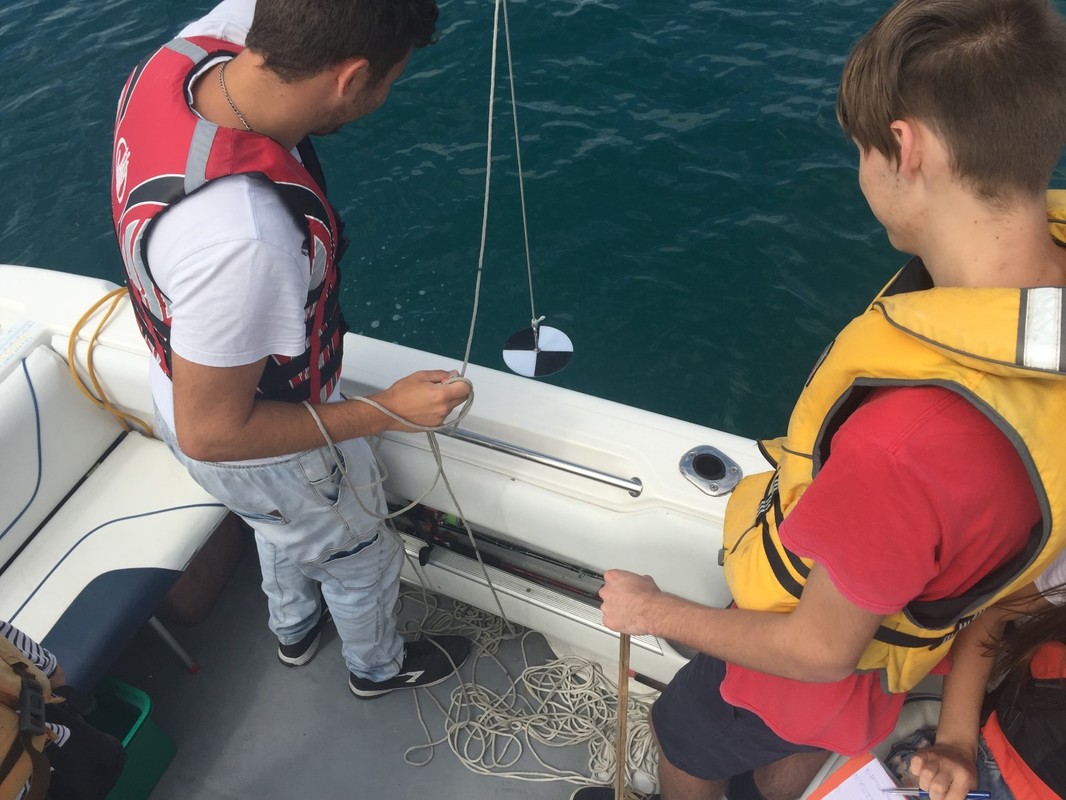
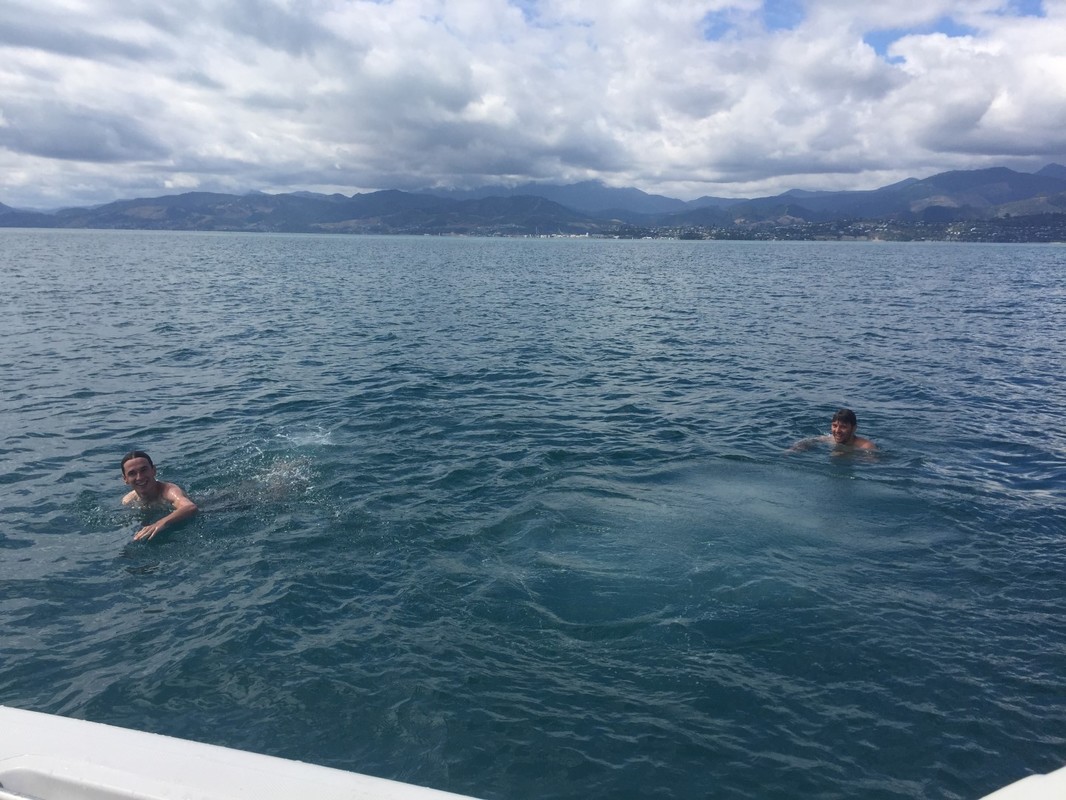
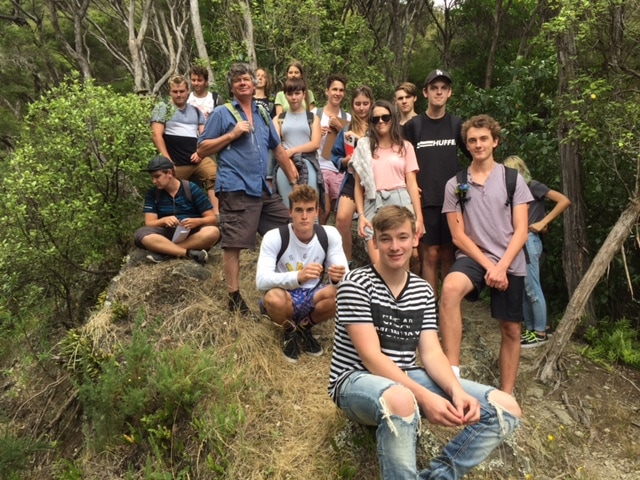
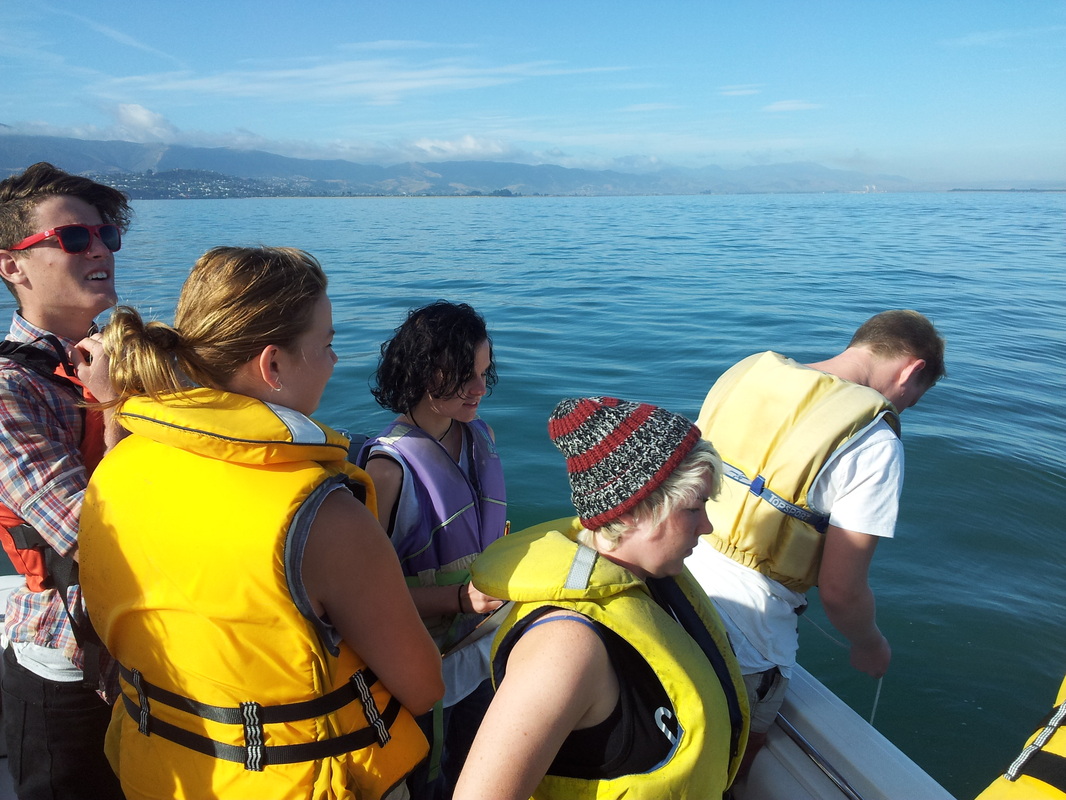
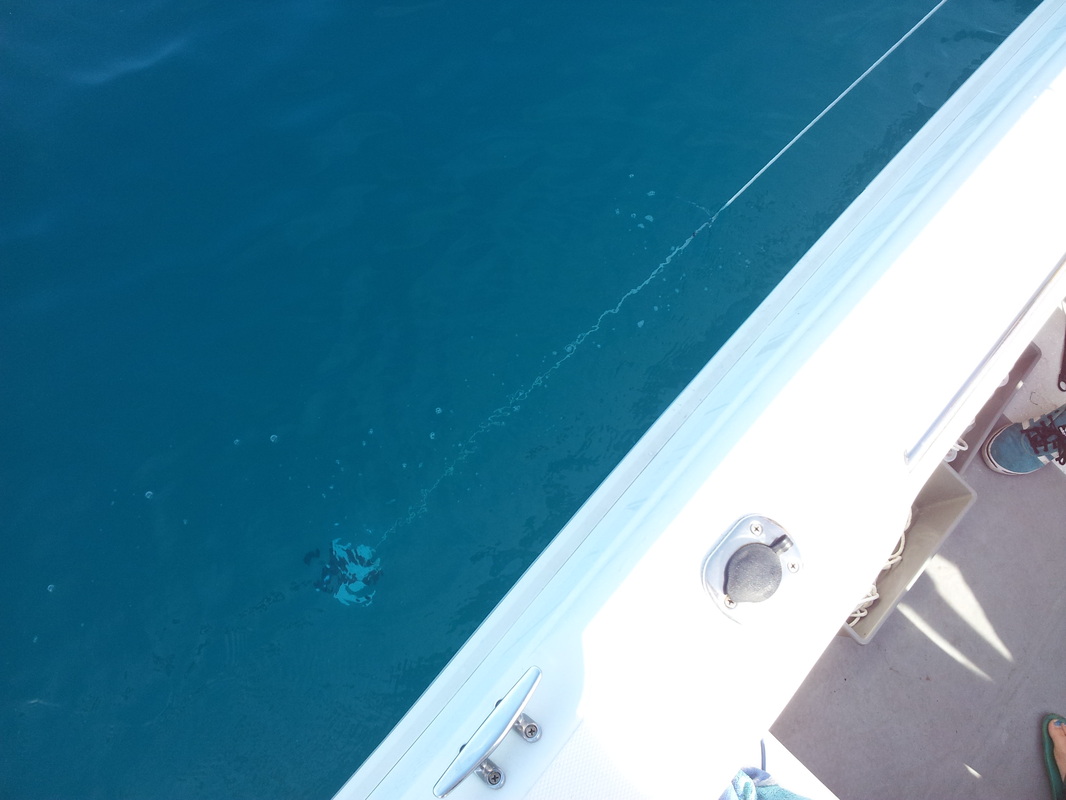
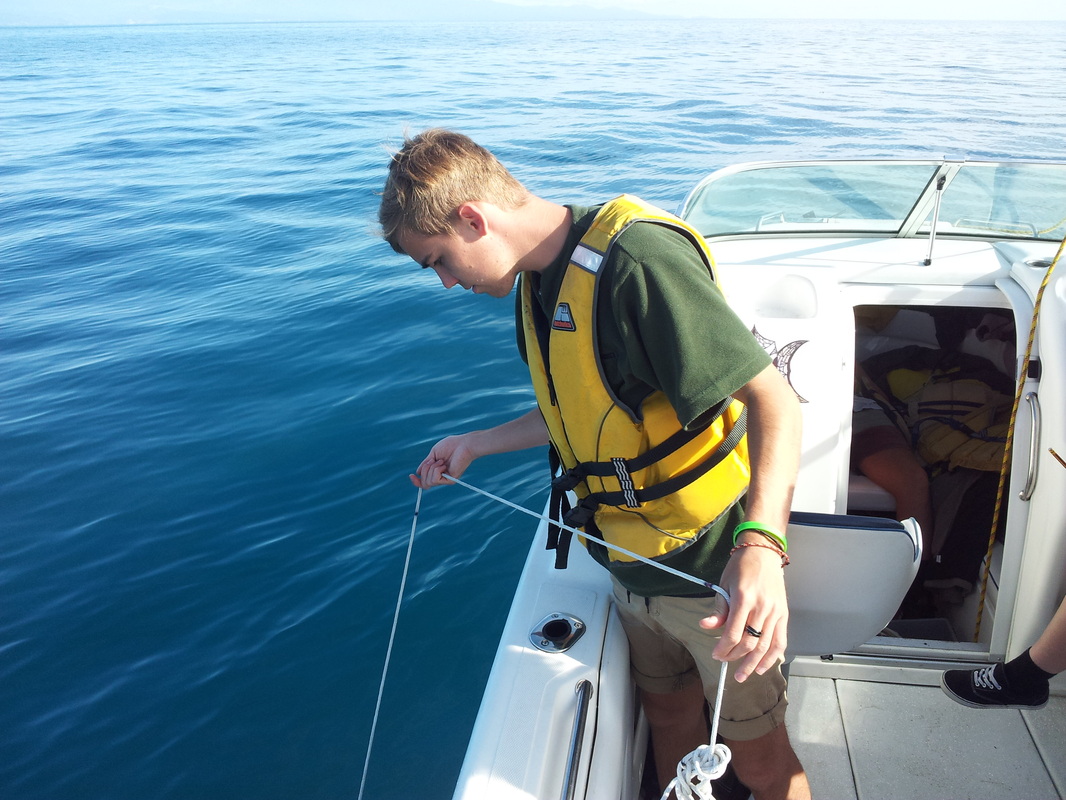
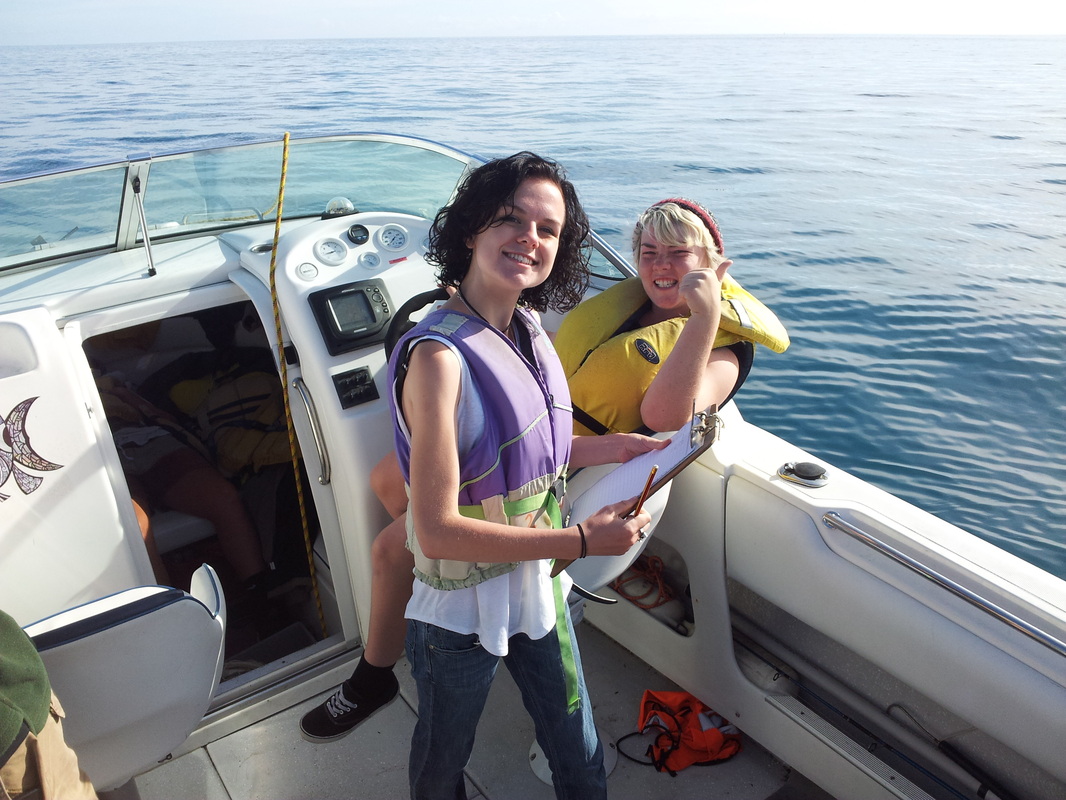
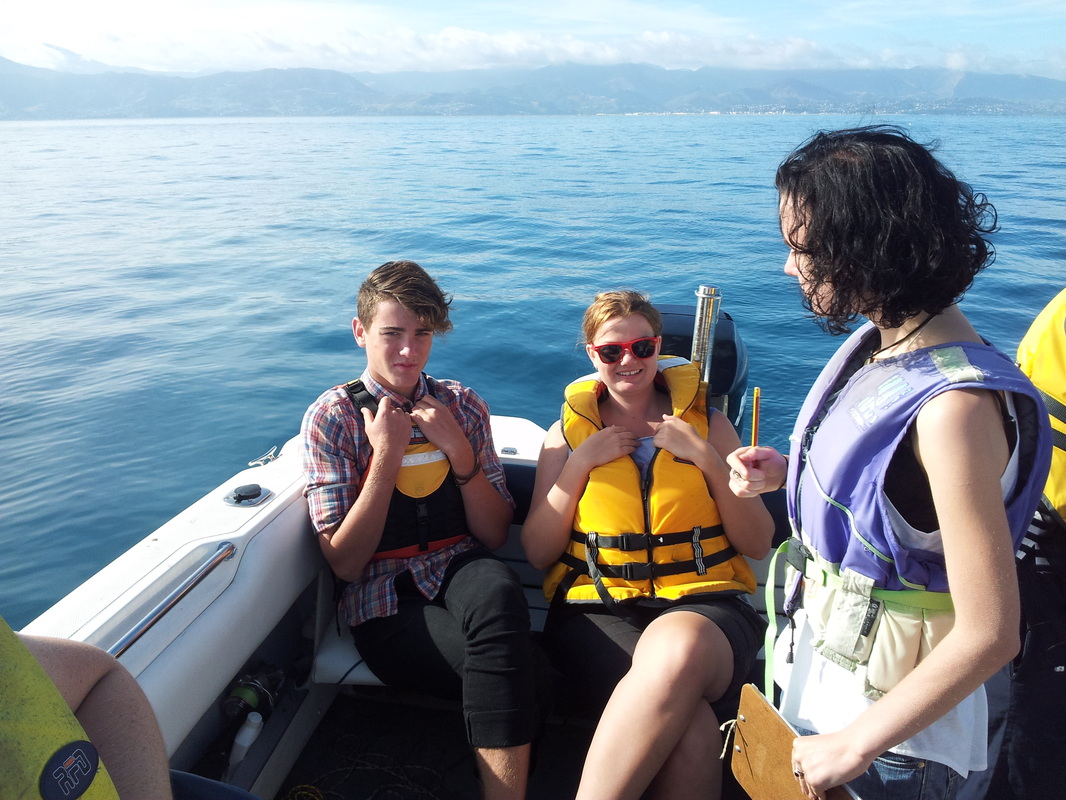
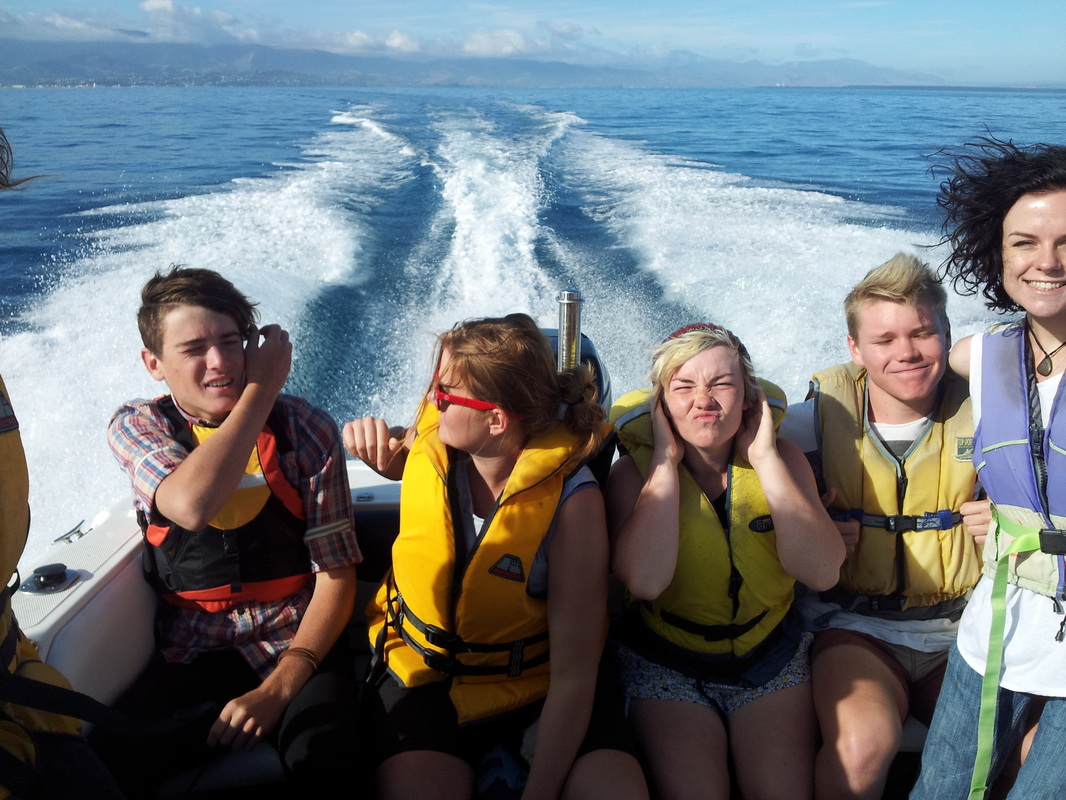
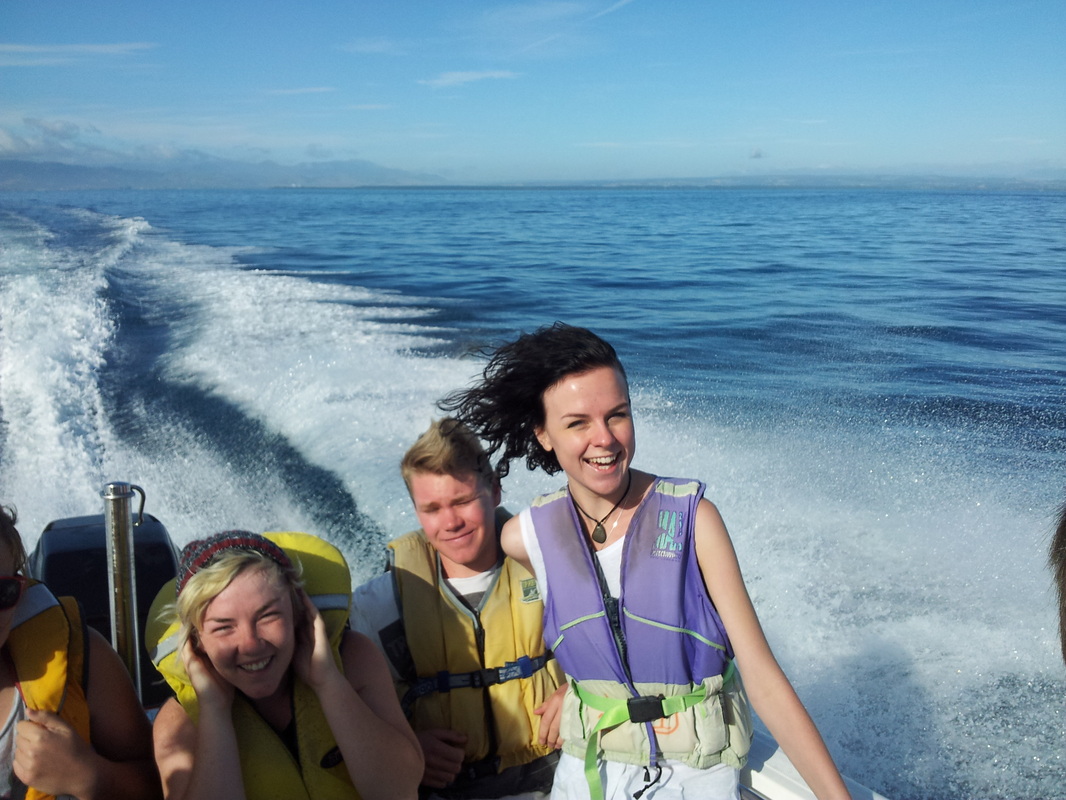
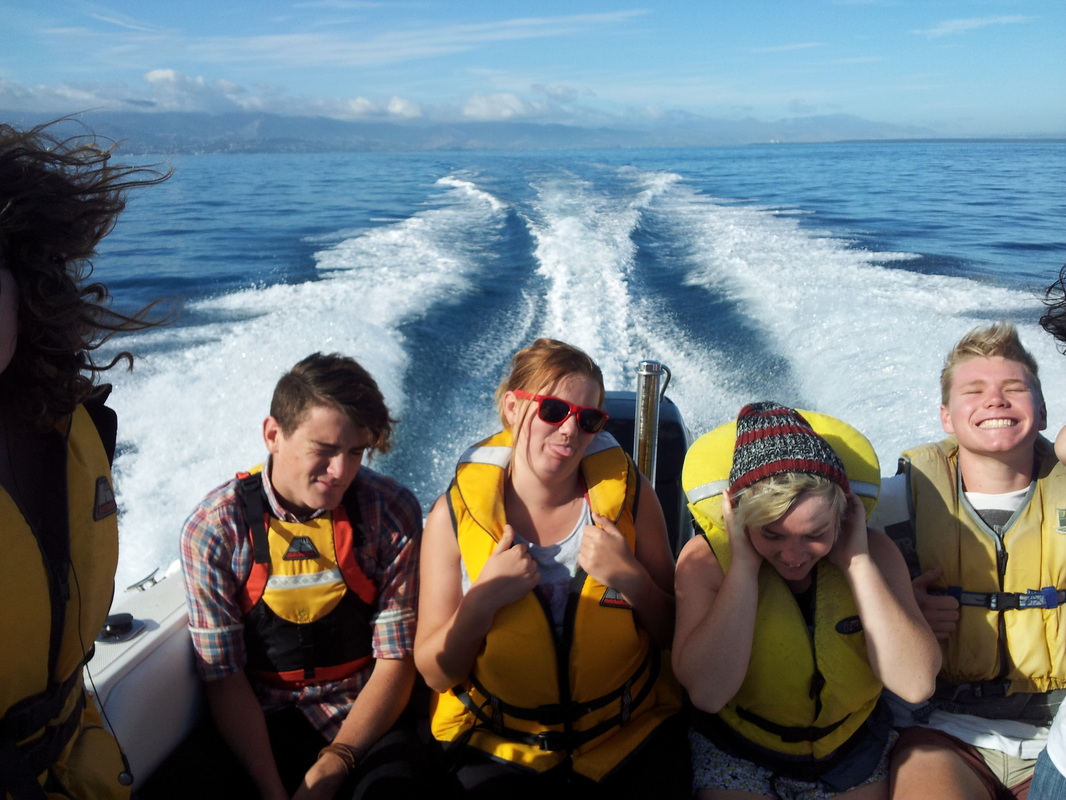
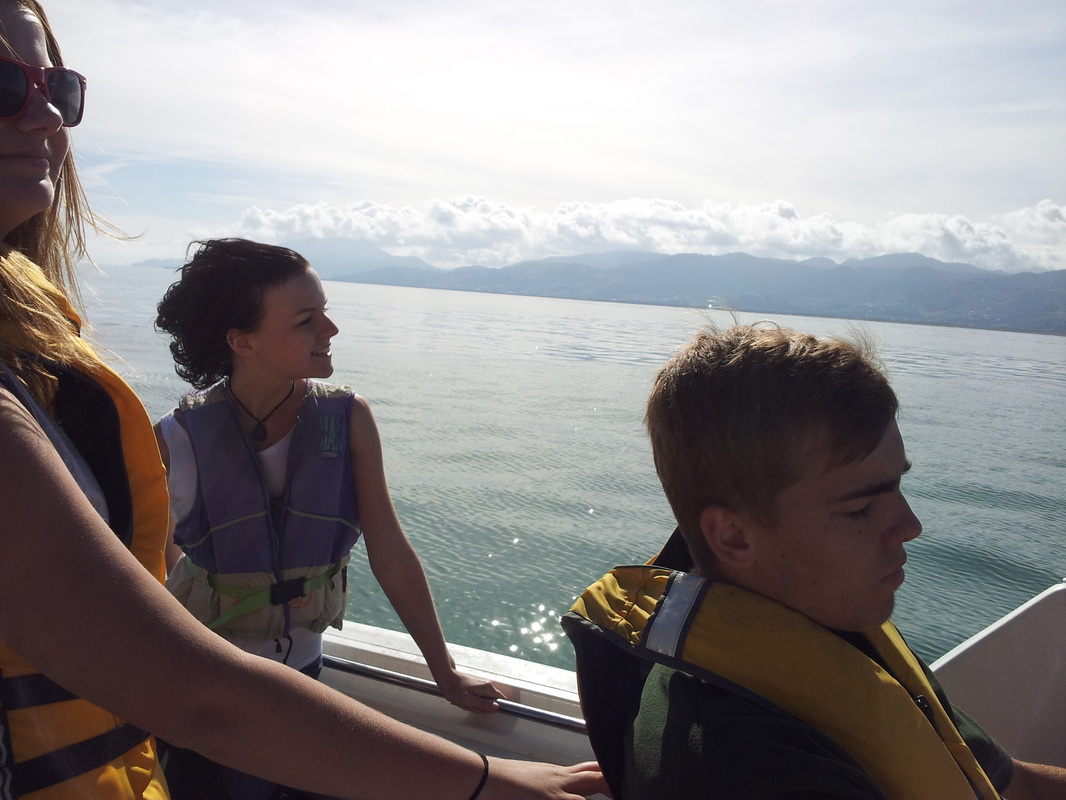
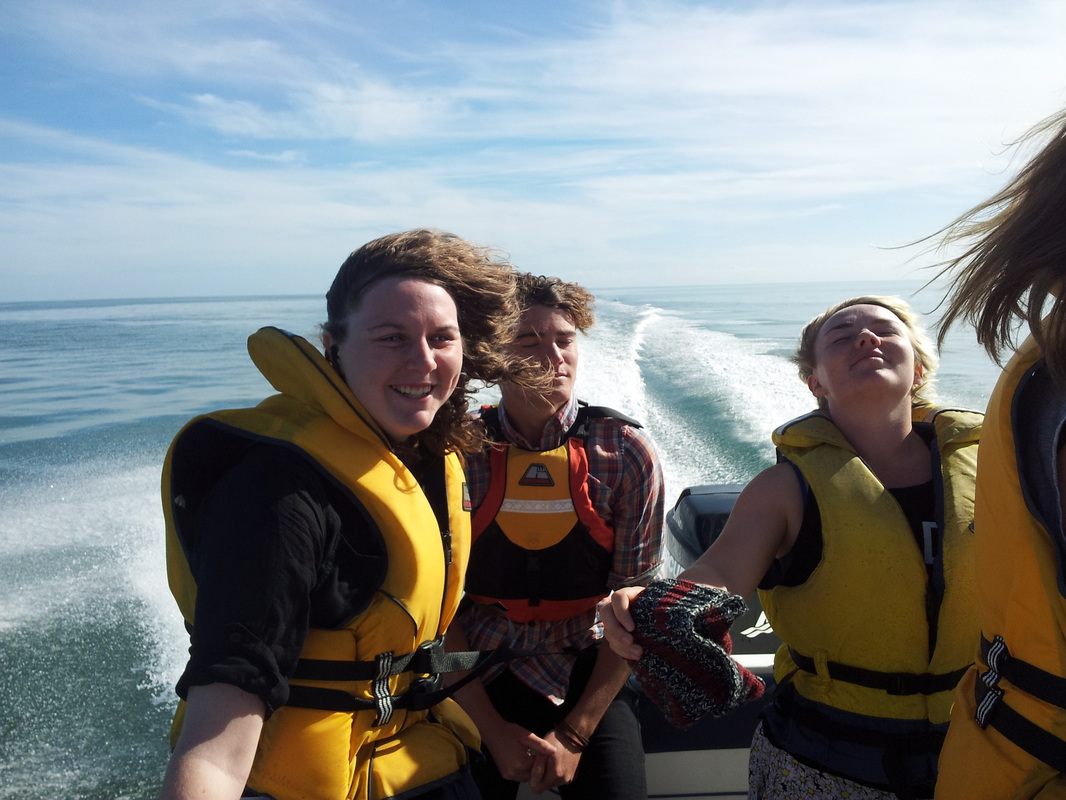
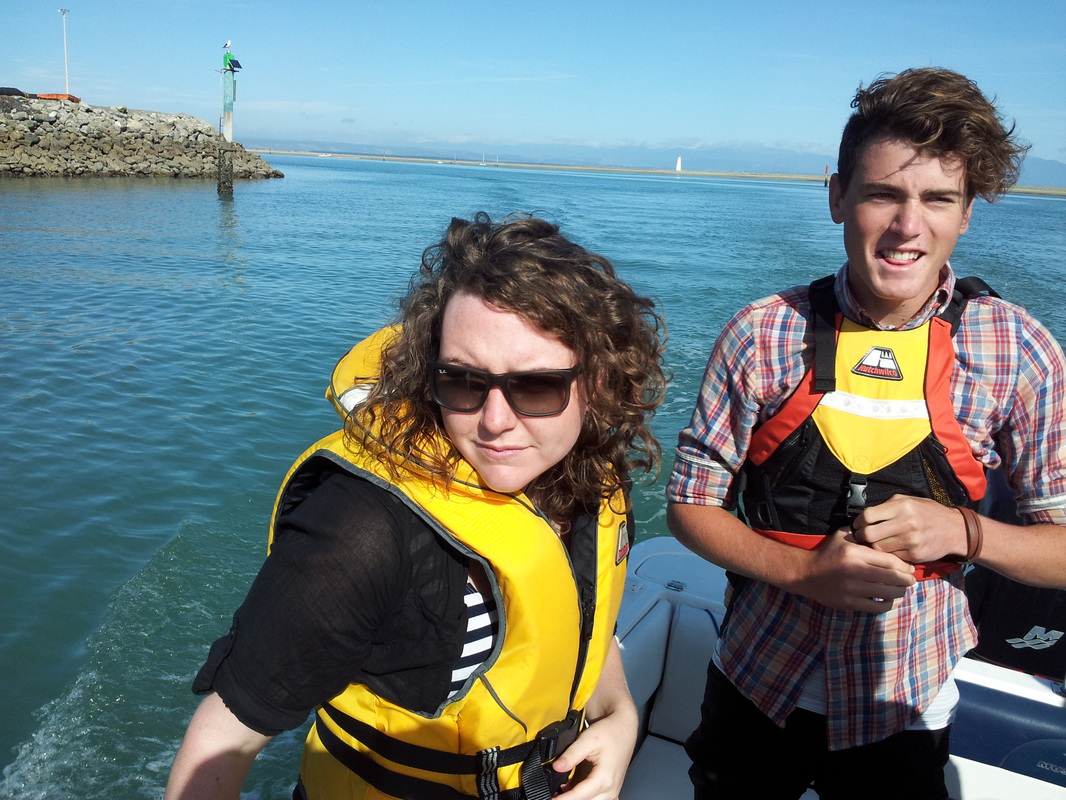
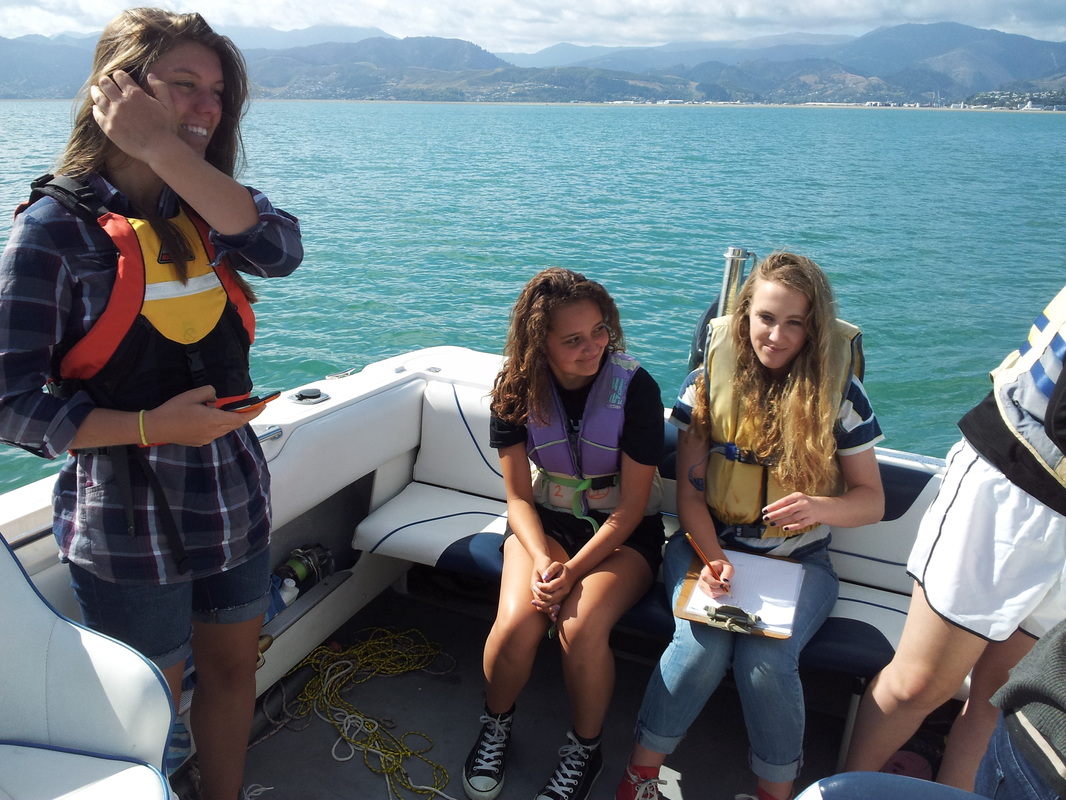
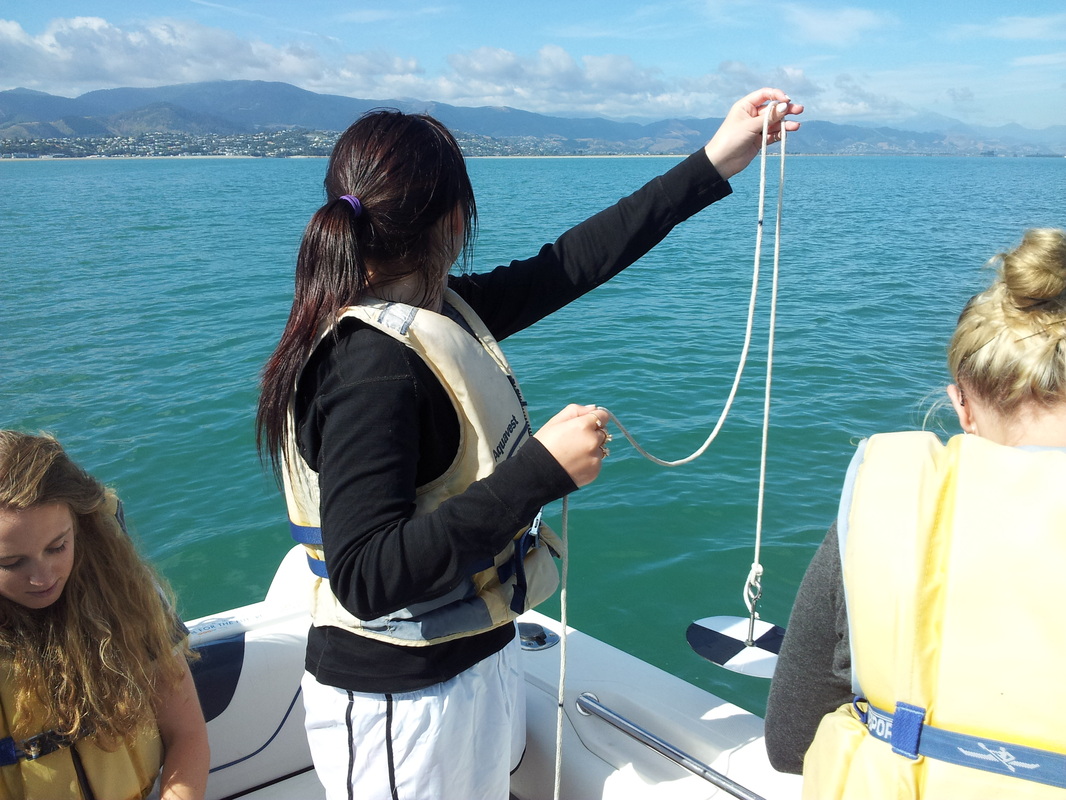
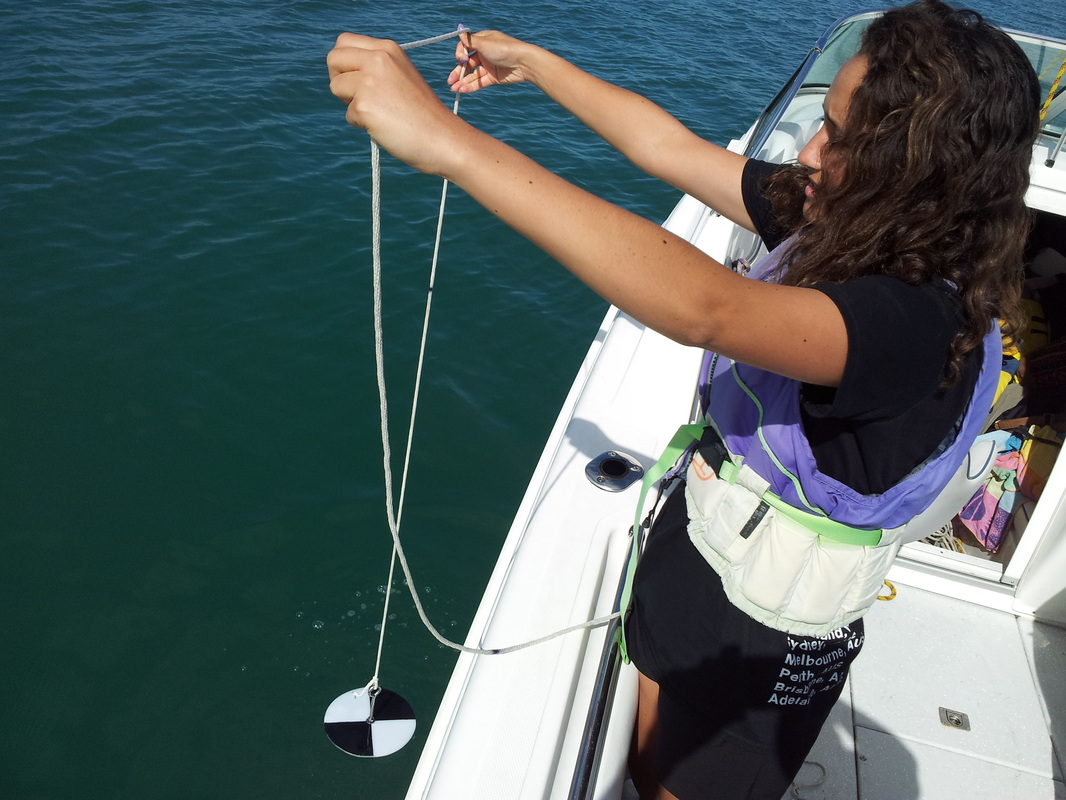
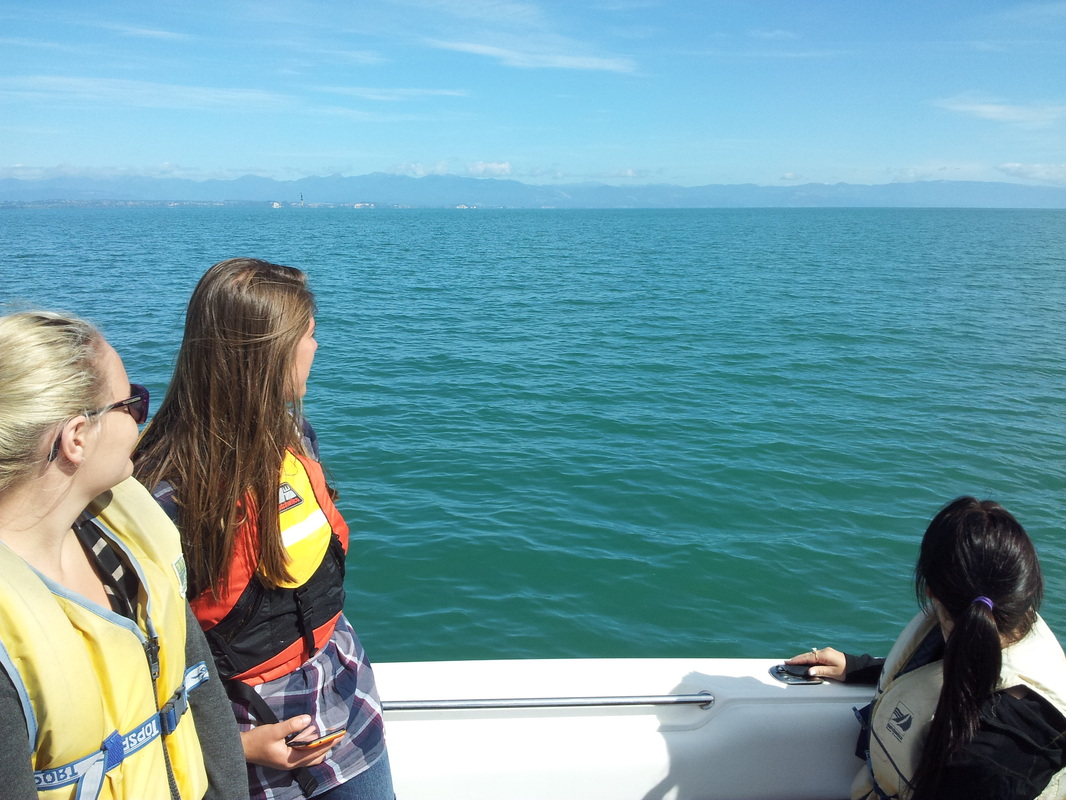
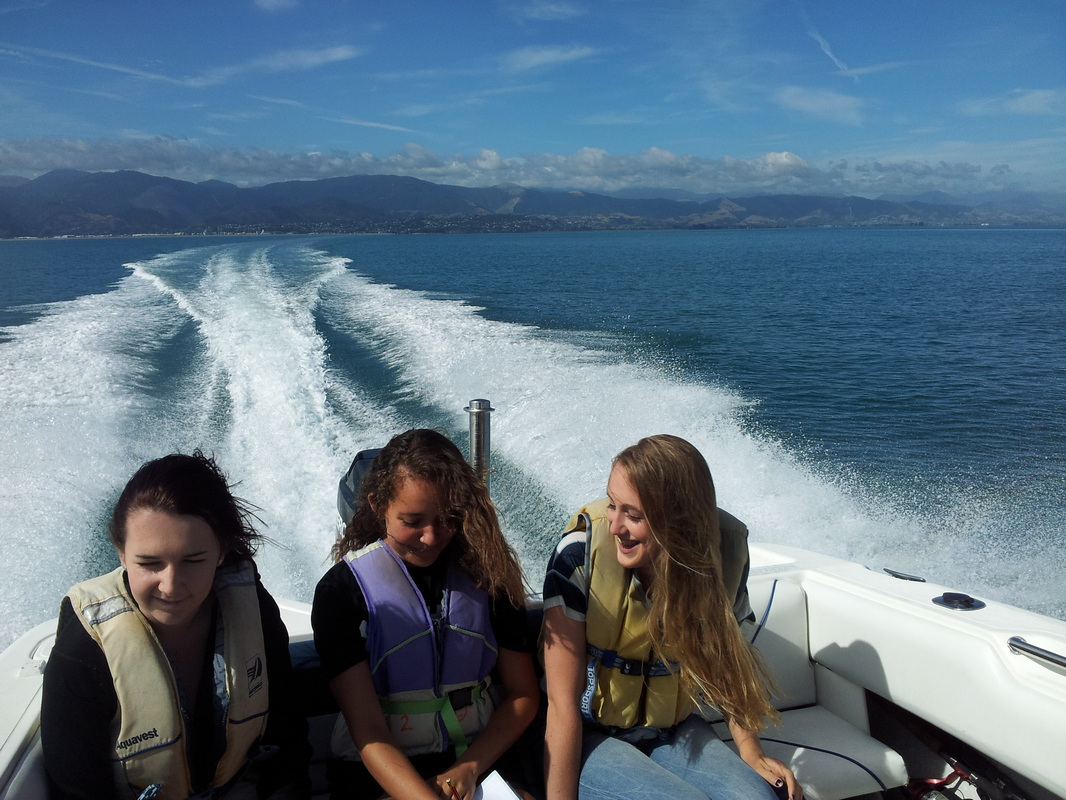
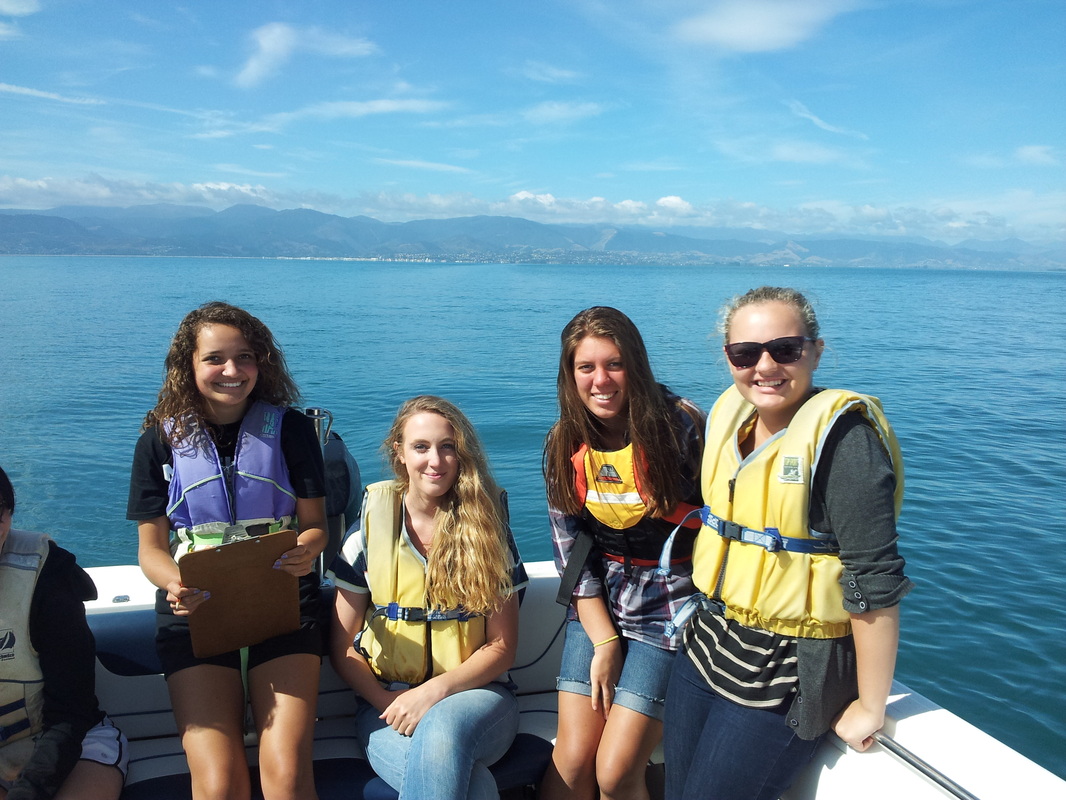
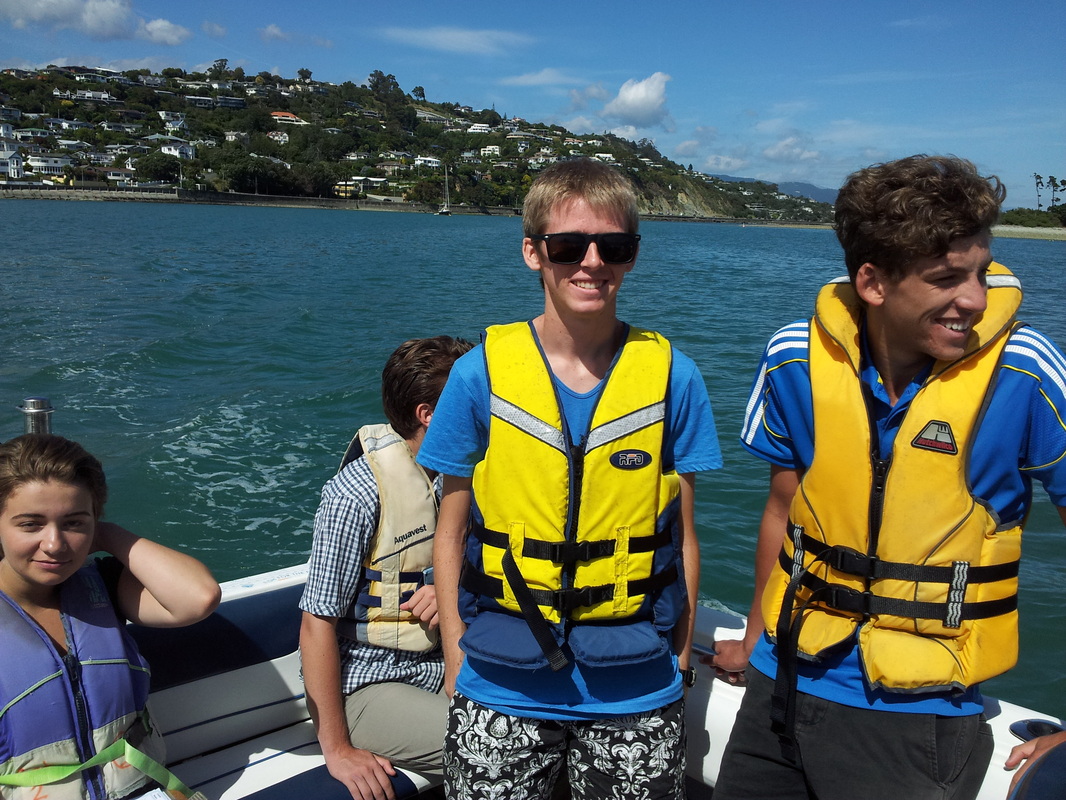
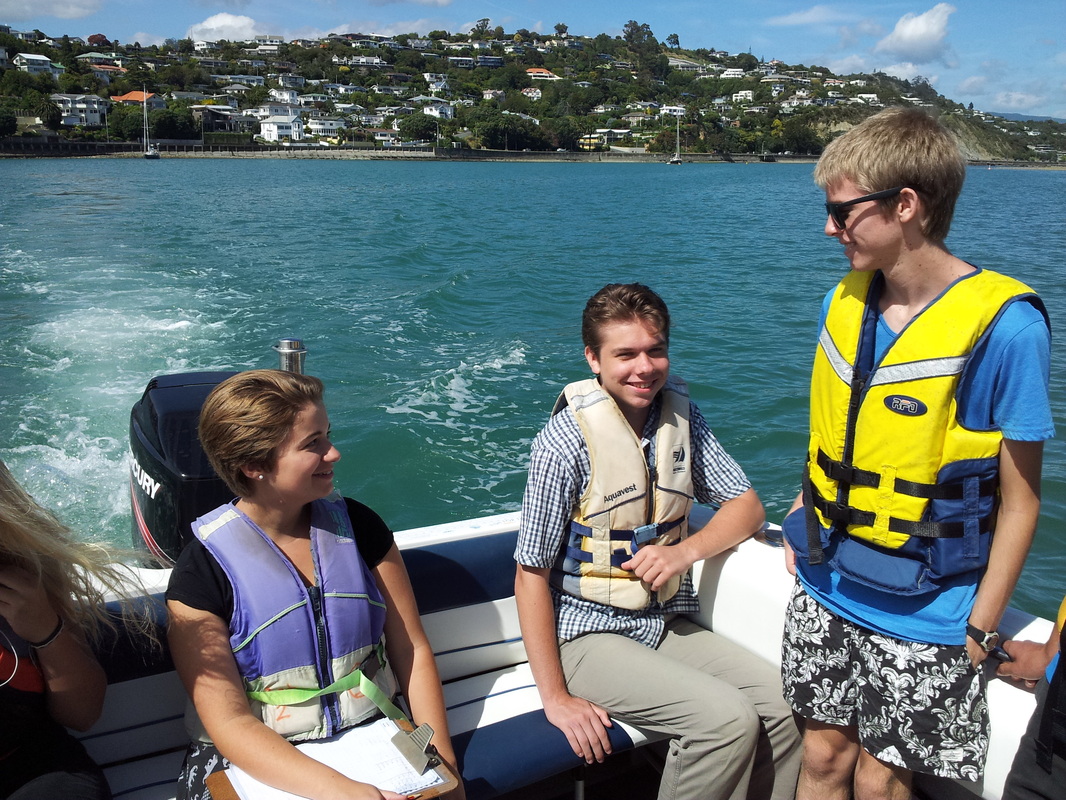
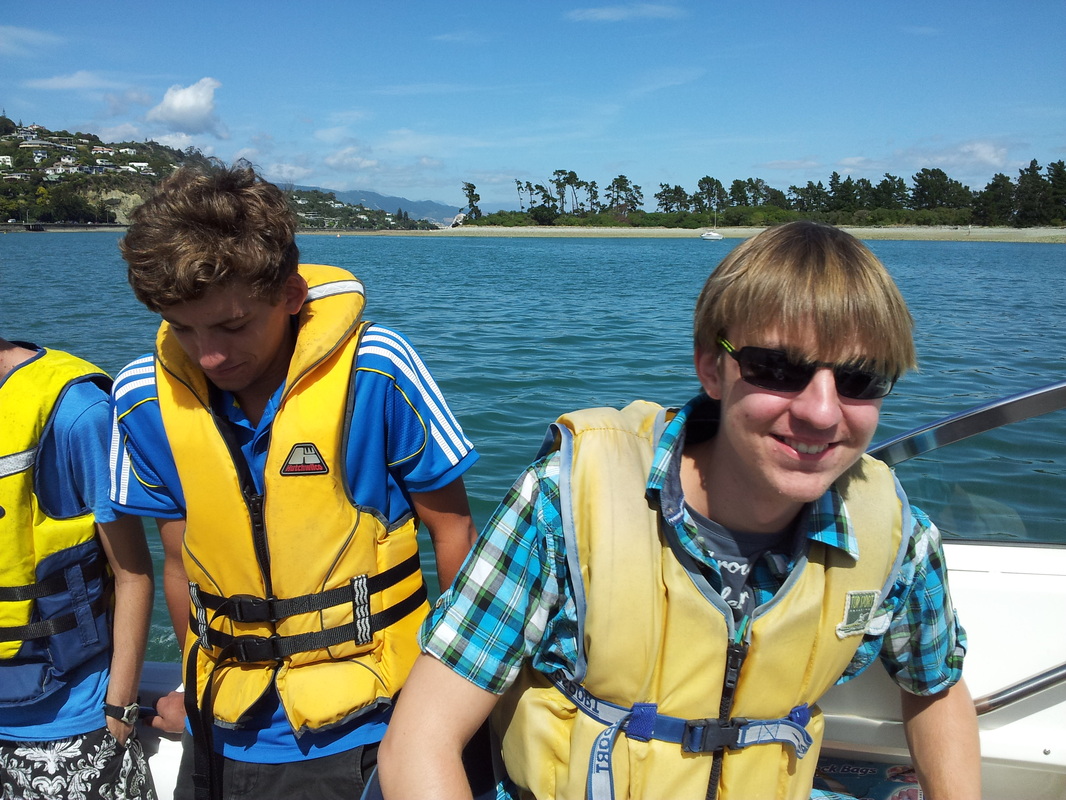
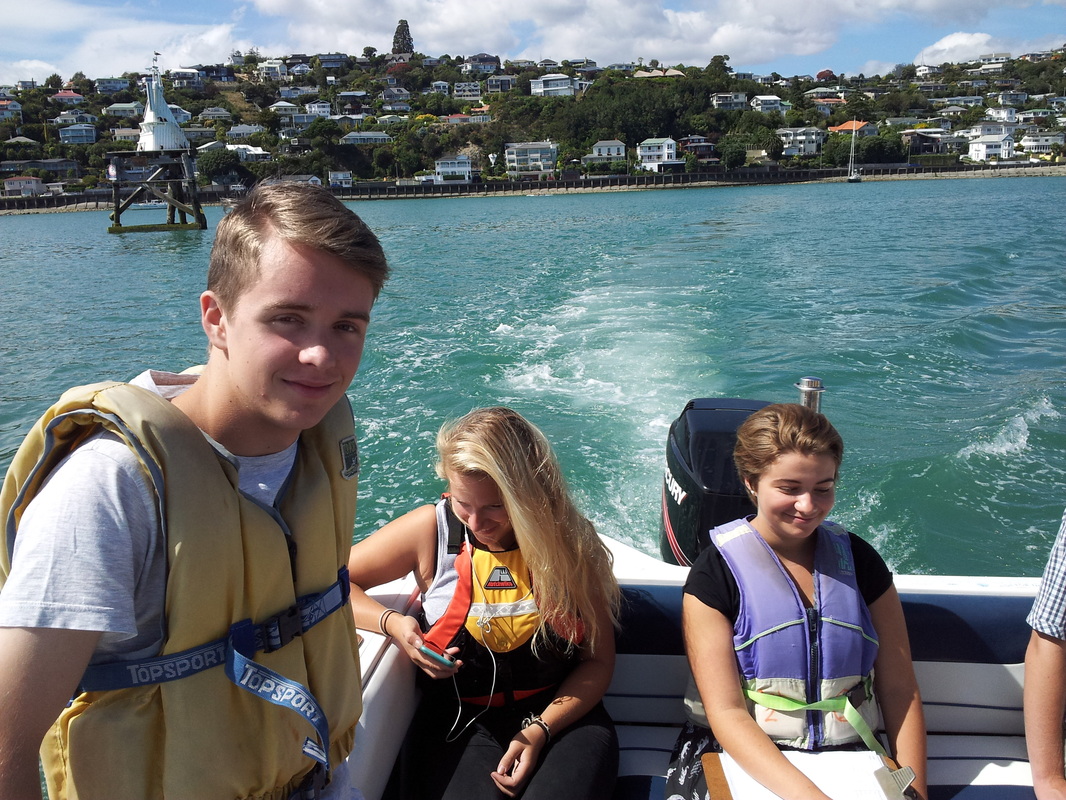
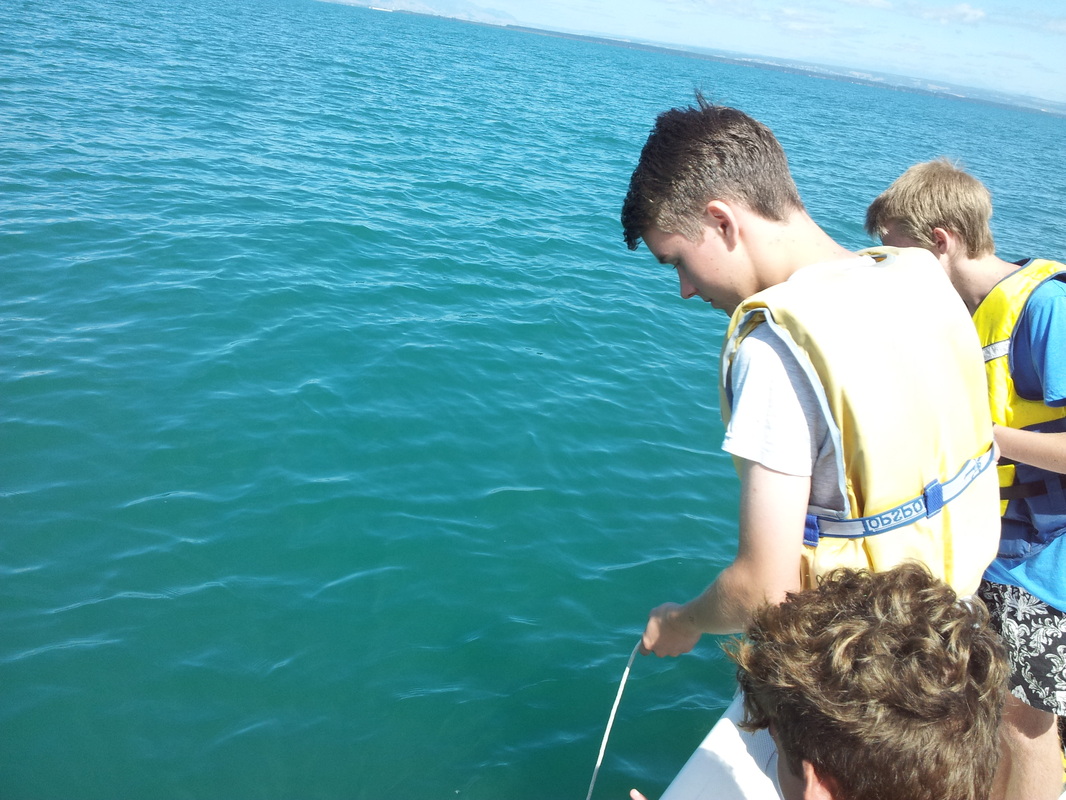
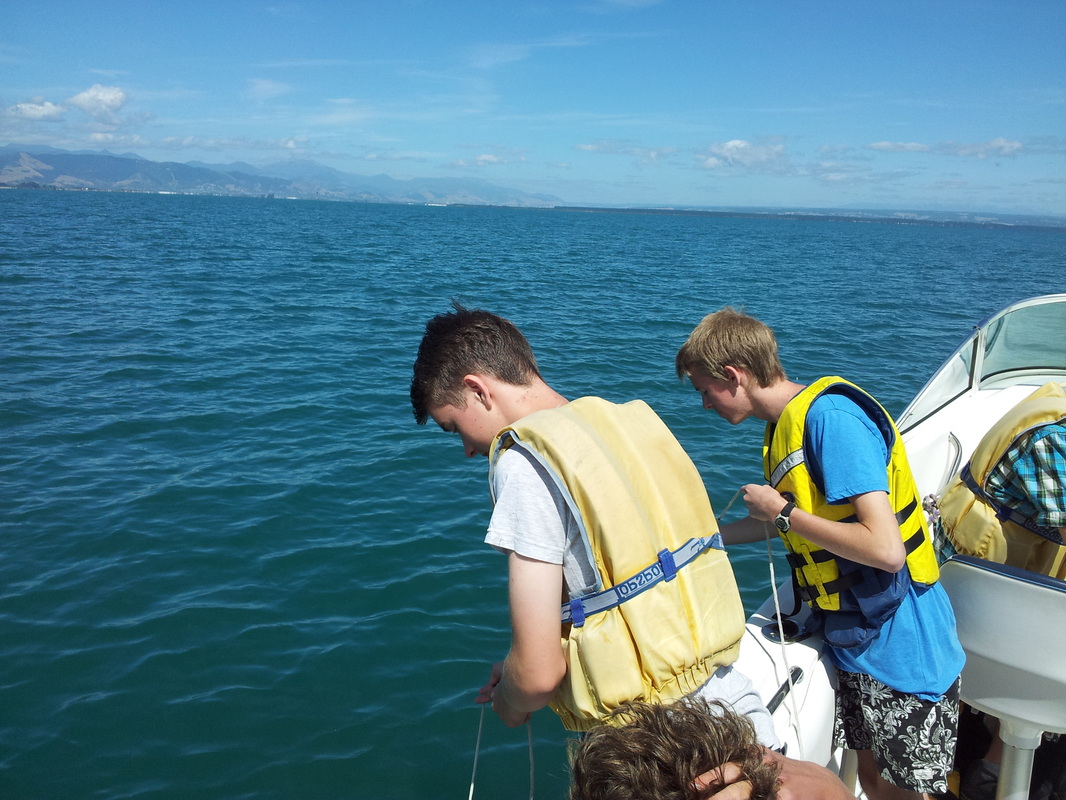
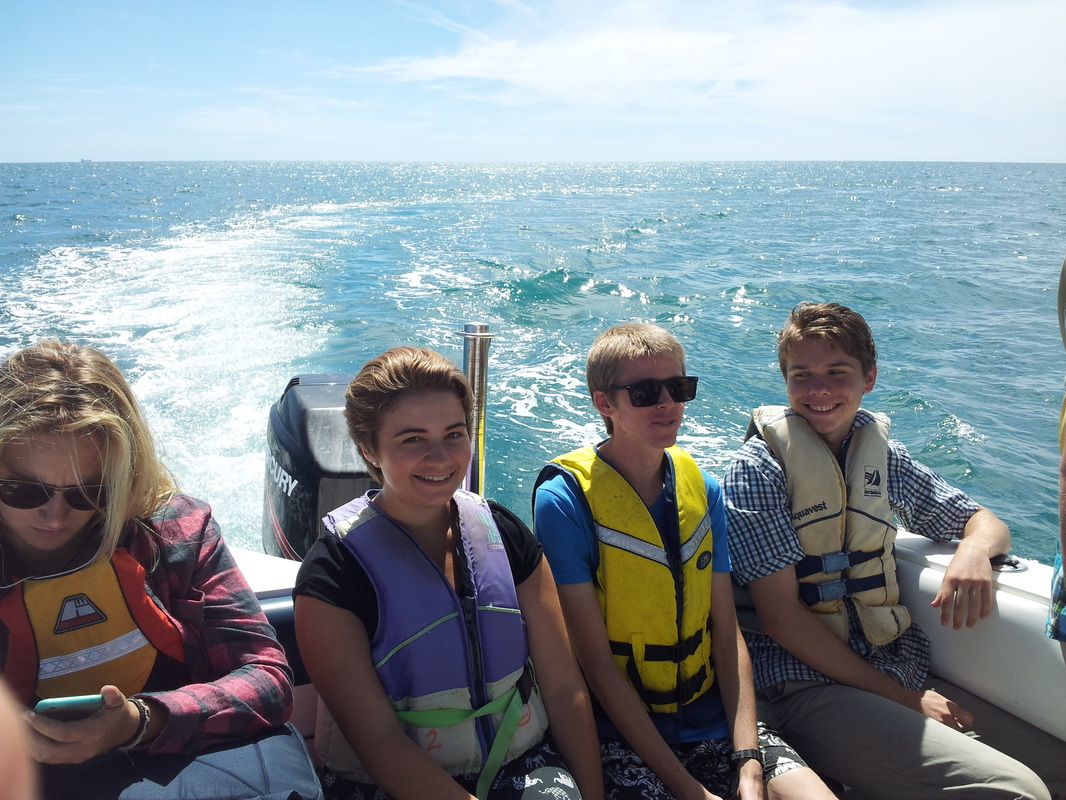
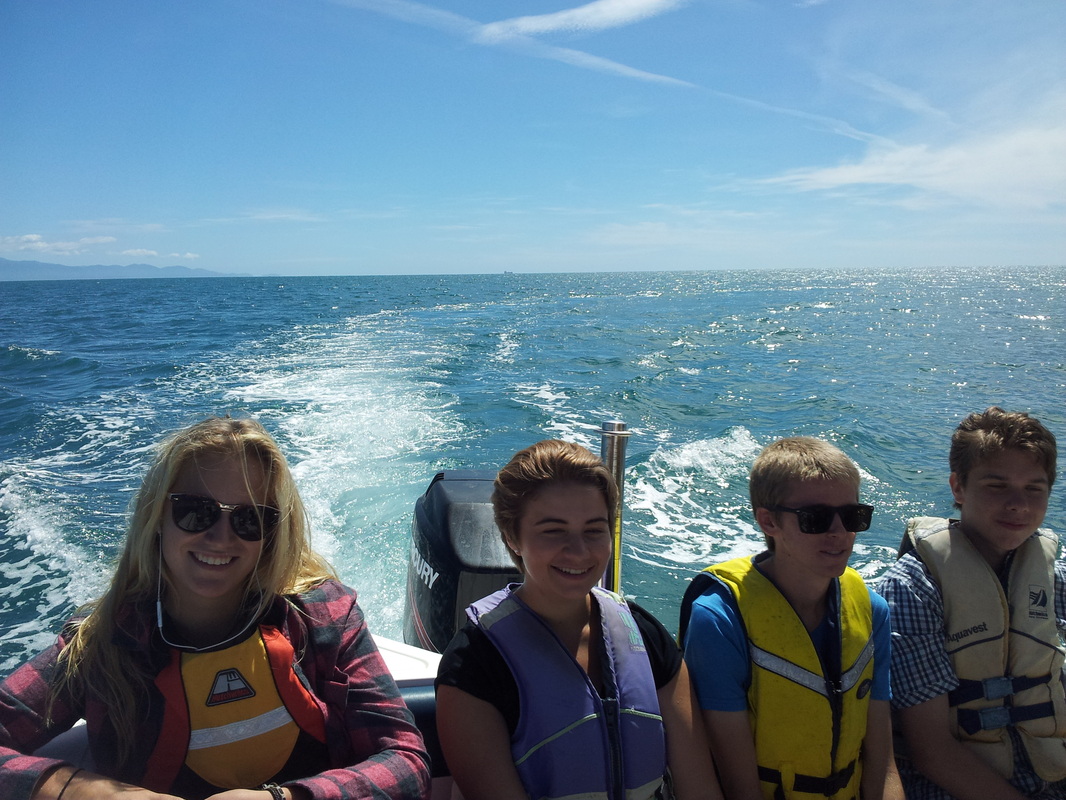
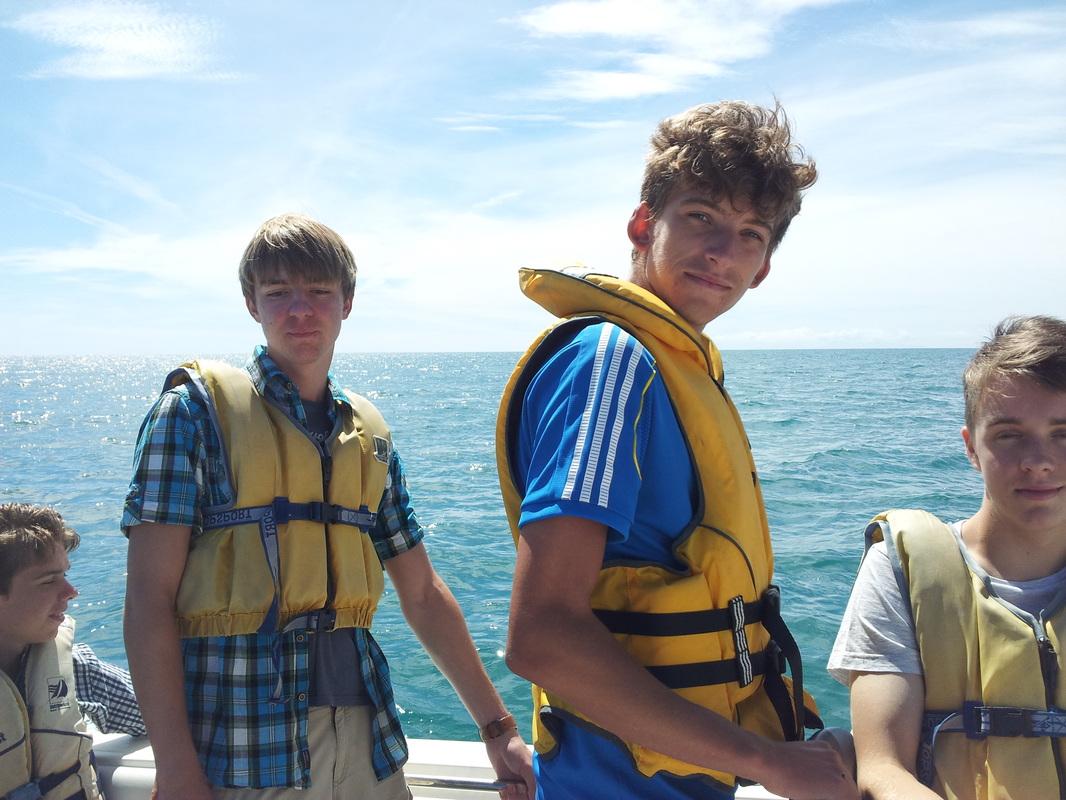
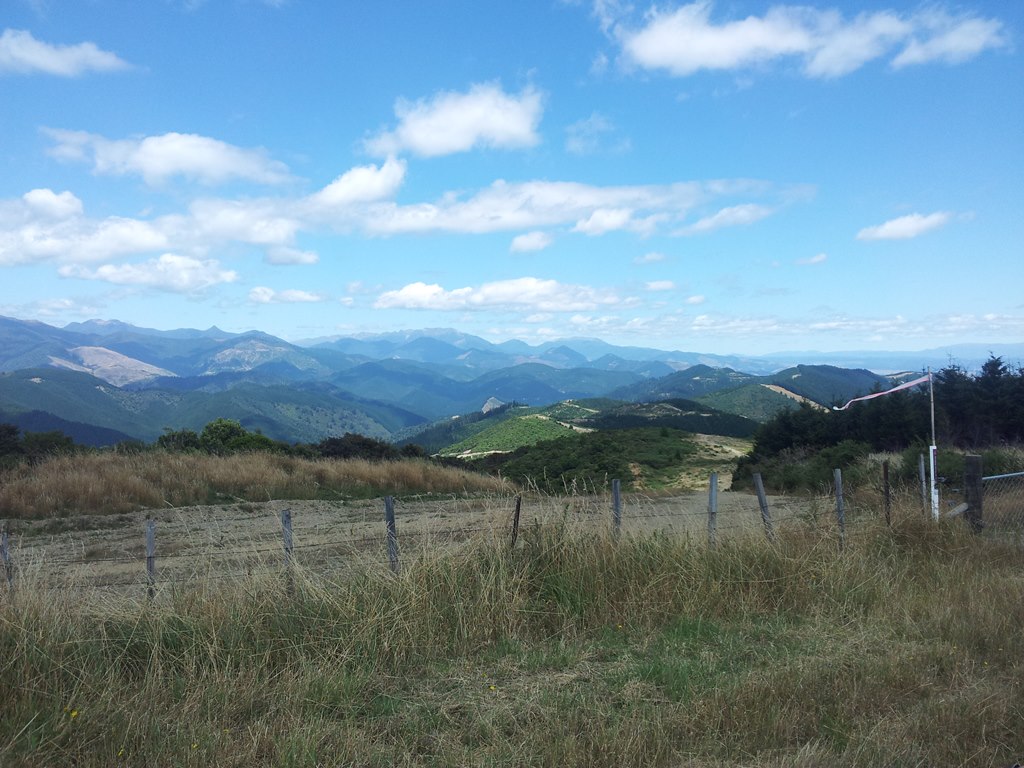
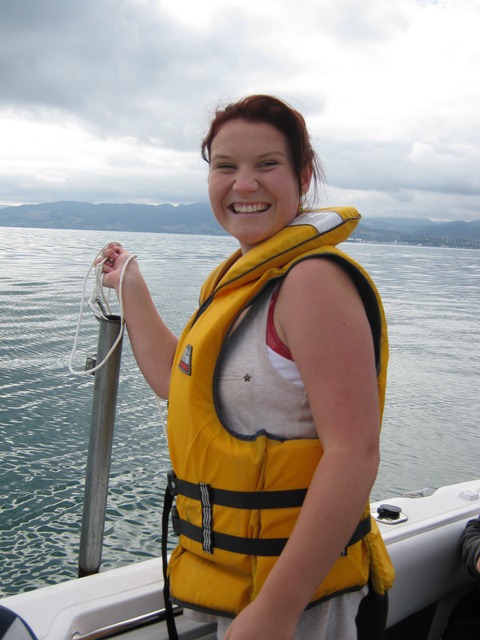
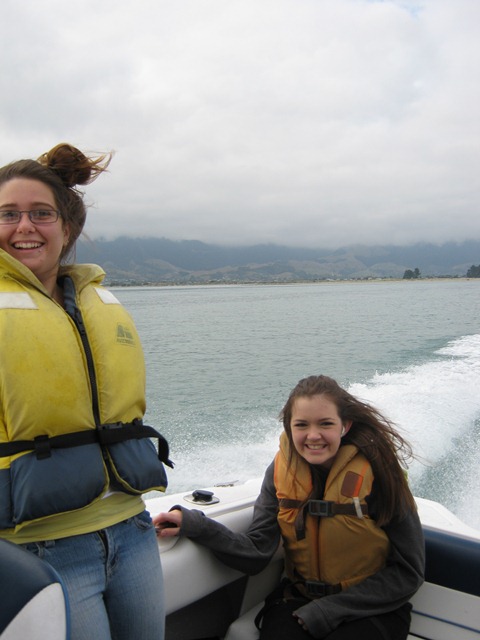
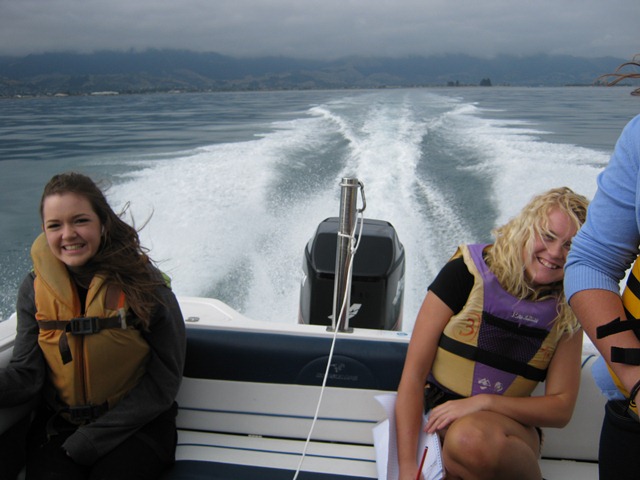
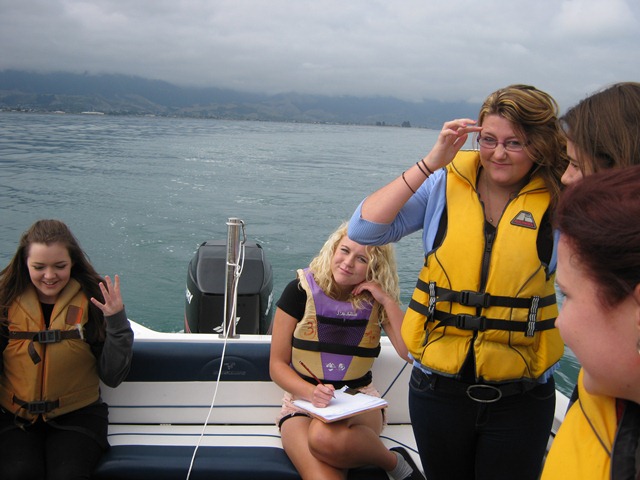
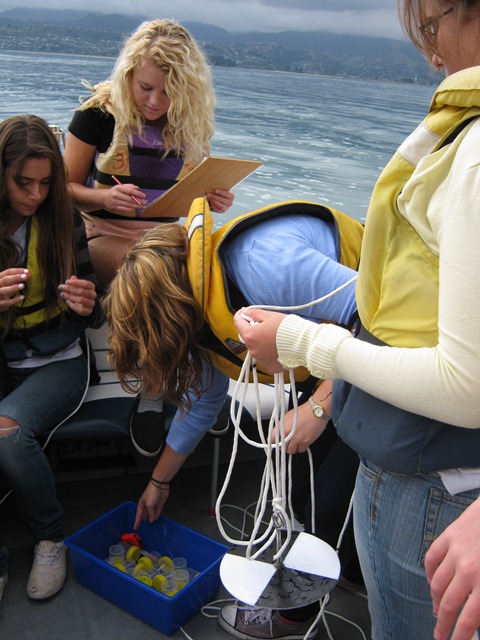
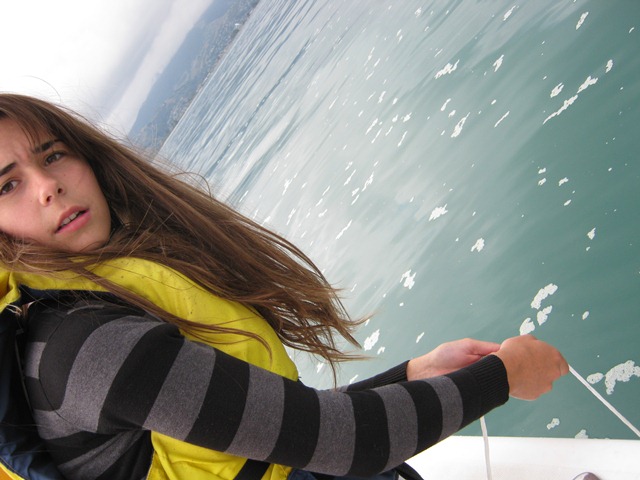
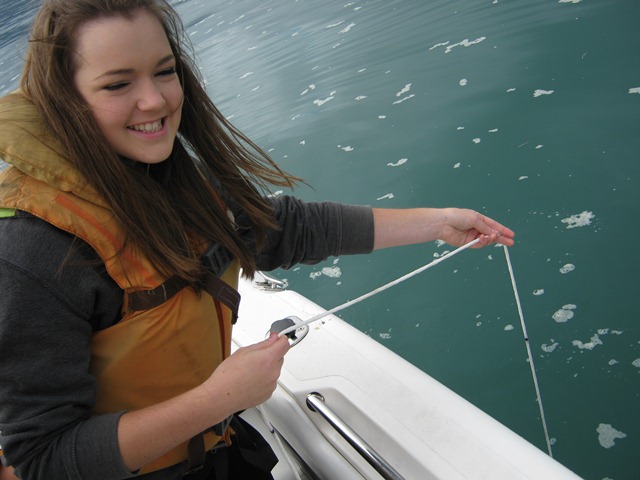
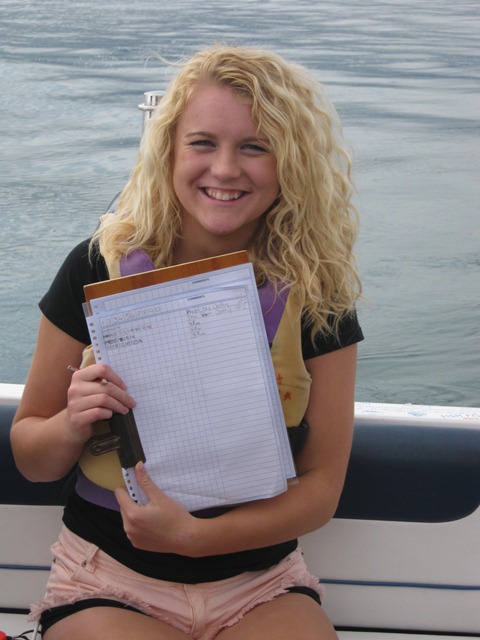
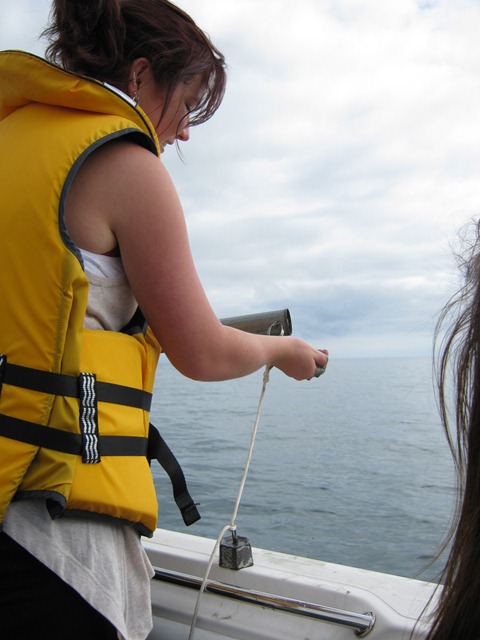
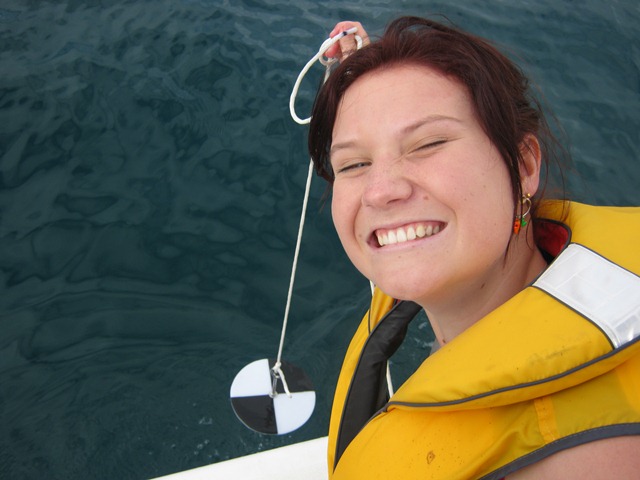
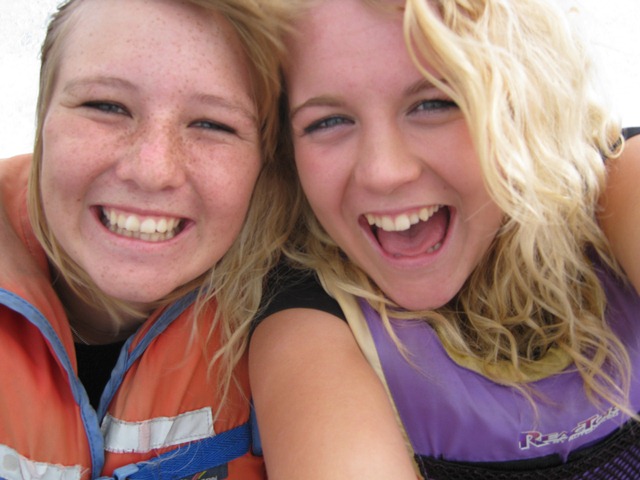
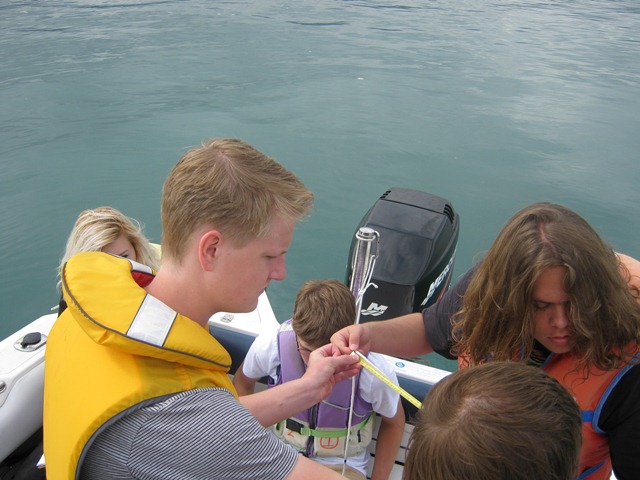
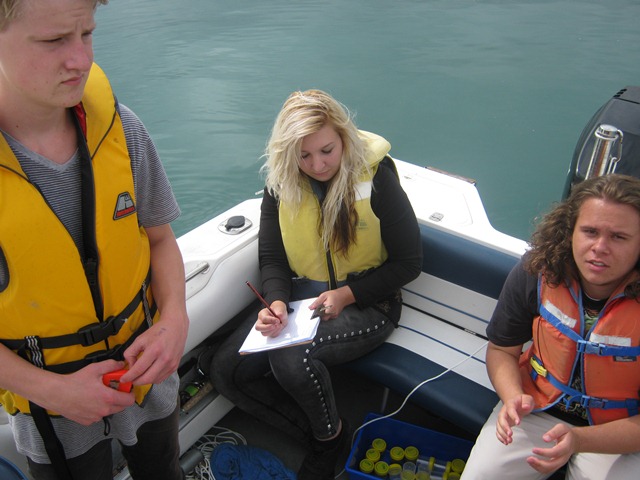
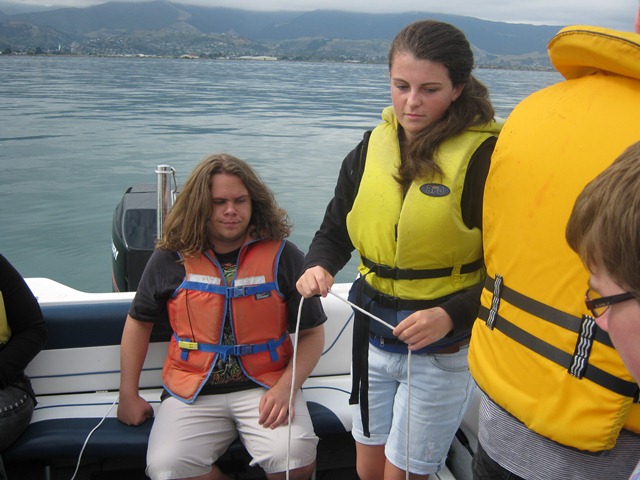
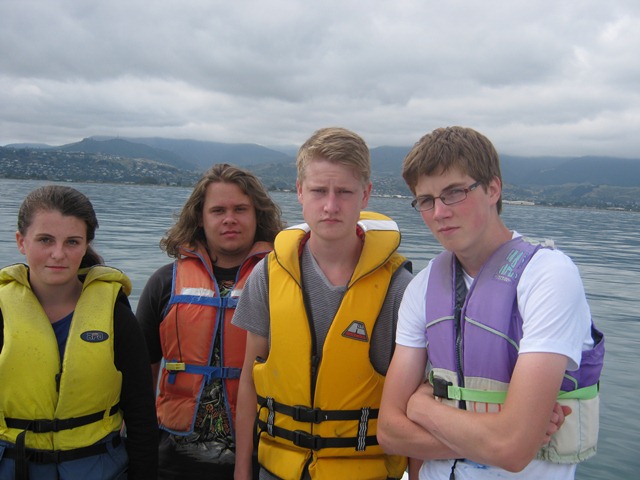
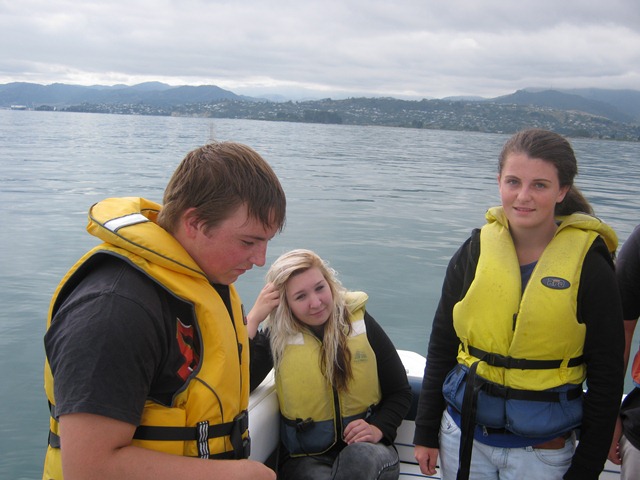
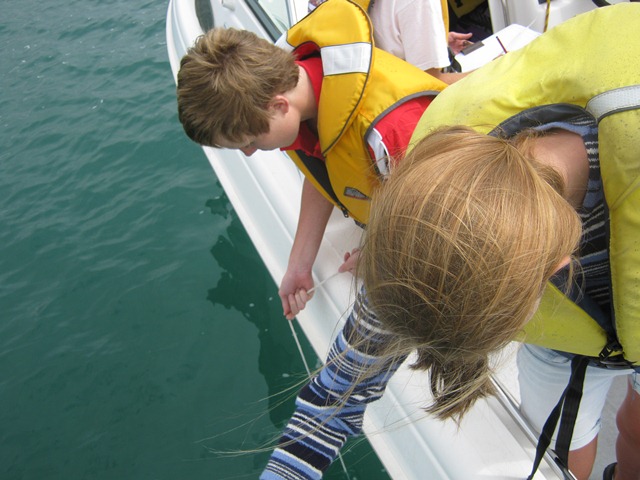
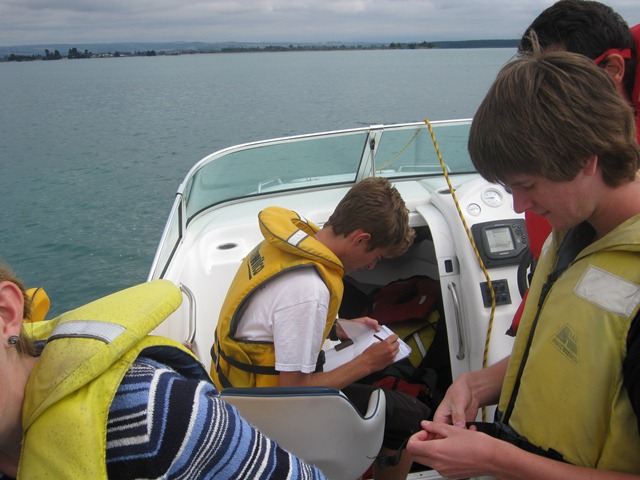
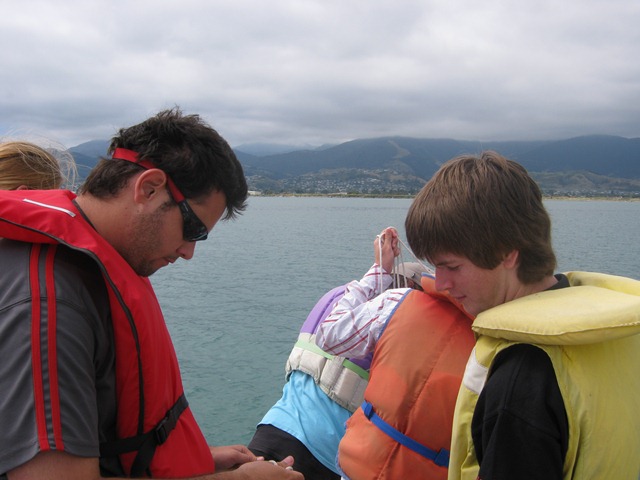
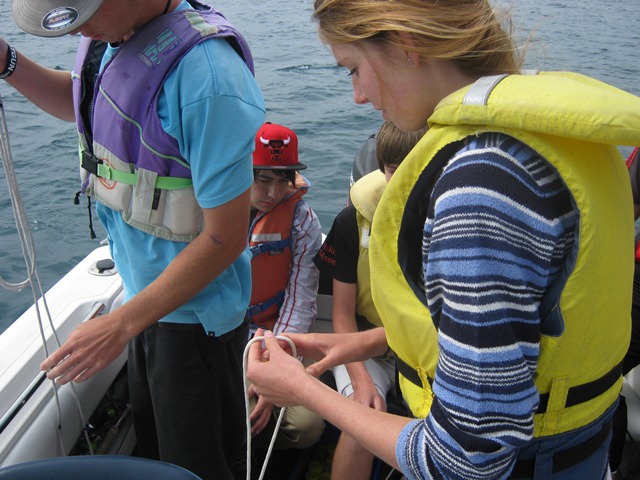
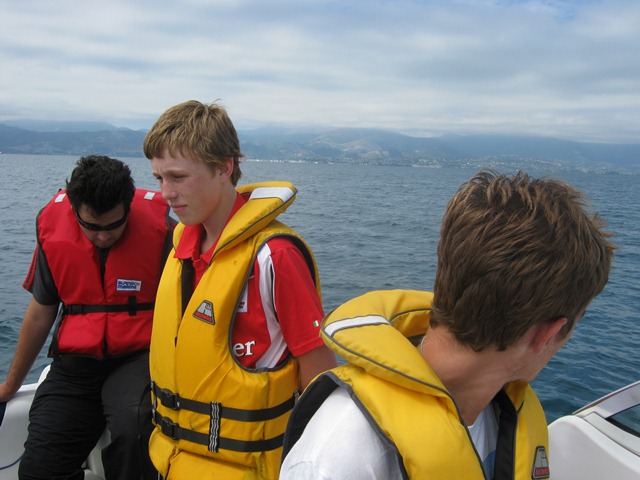
Here we are doing lots of hard work.....
some of these images might find their way into your report?
some of these images might find their way into your report?
TasBay trip July 2021
TasBay trip Feb 25 , 2020
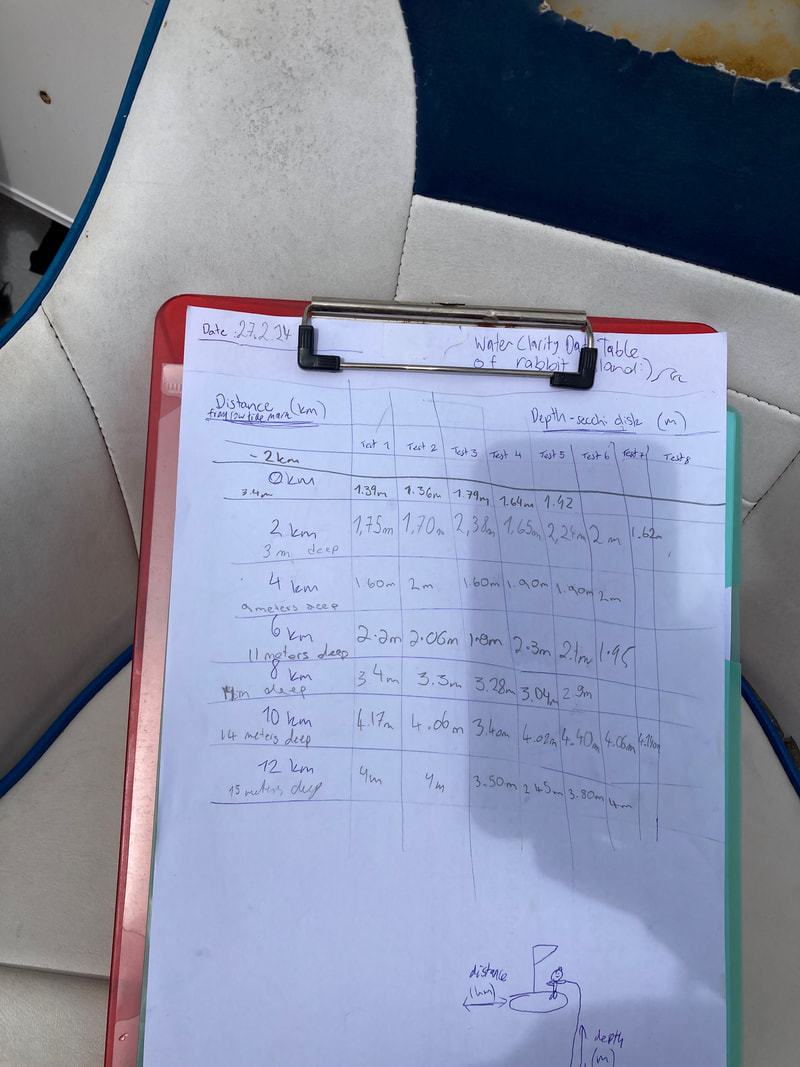
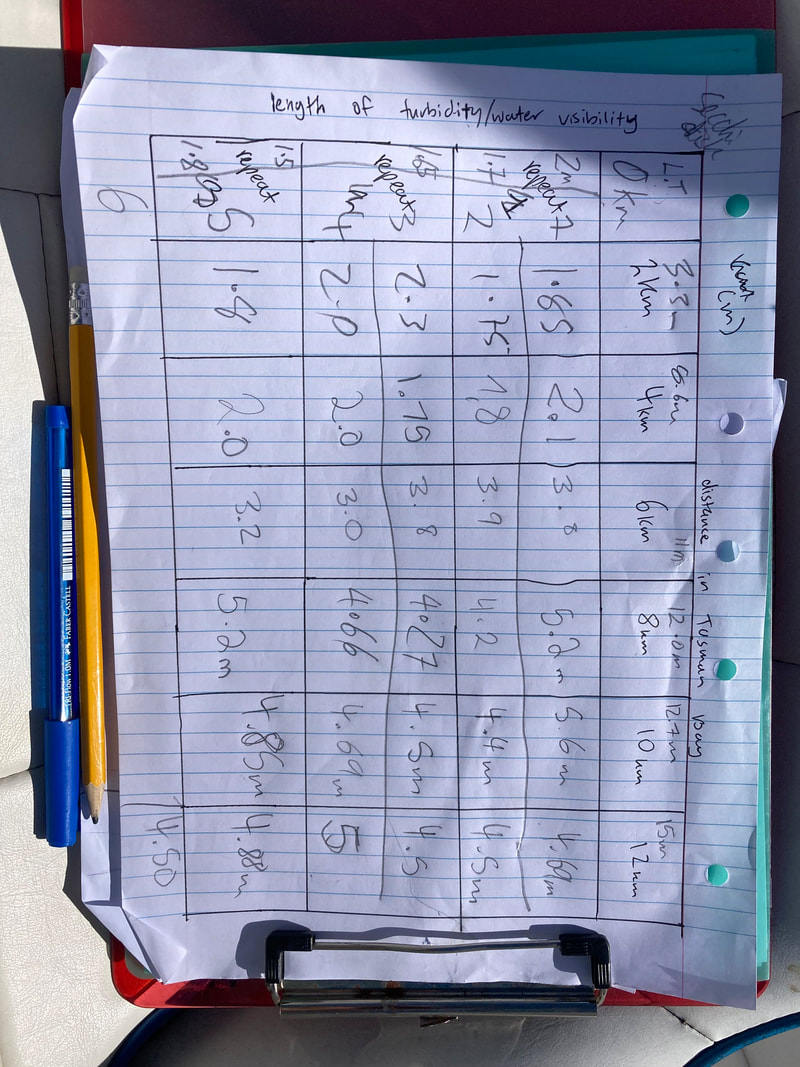
Our data is in your OneNote ... called (surprisingly)... raw data
Tasman Bay trip March, 2019
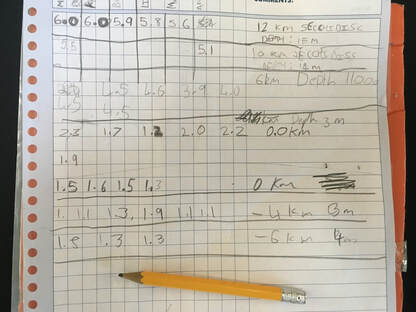
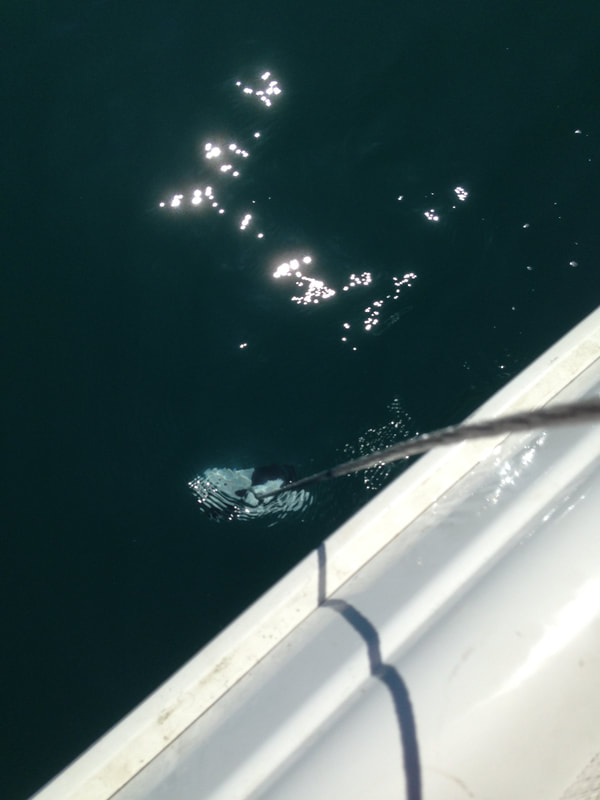
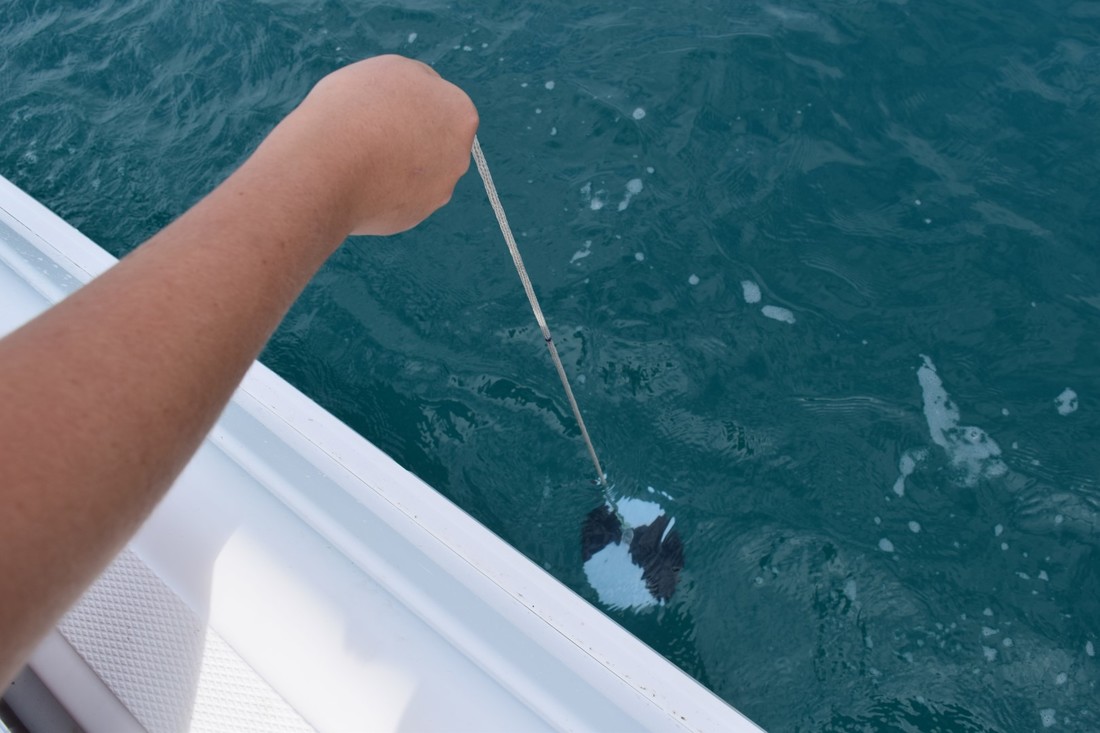
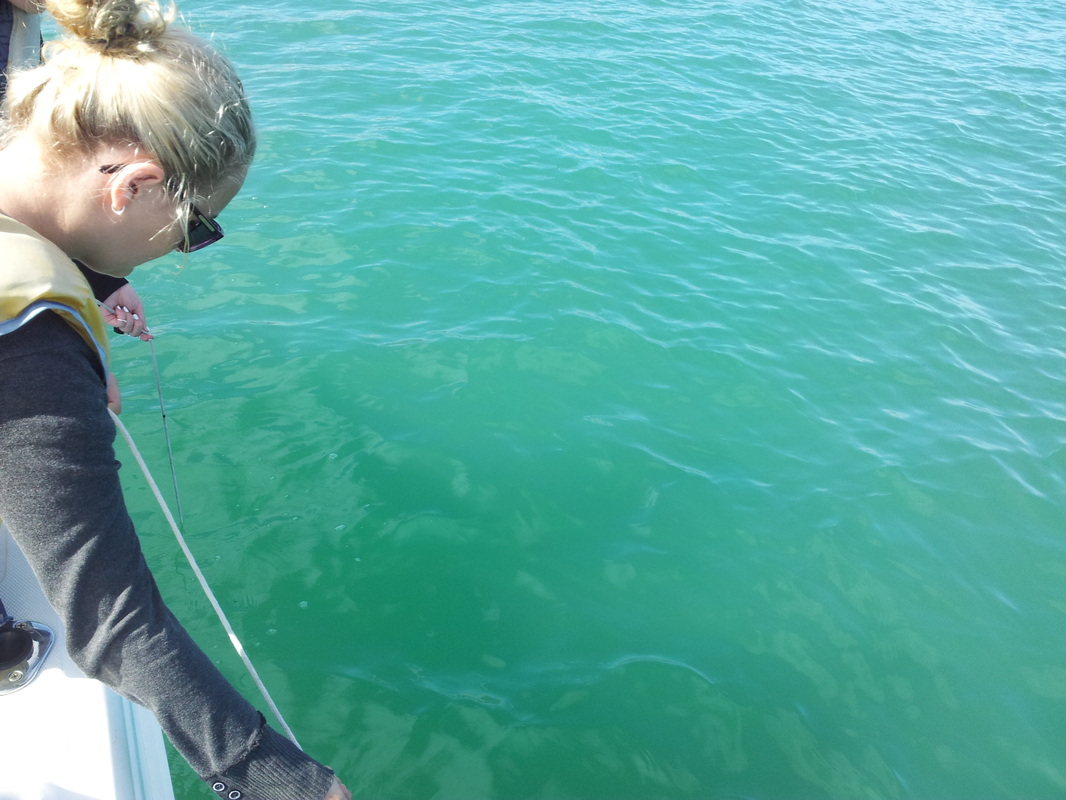
Luckily we got some more secchi data on the same day courtesy of our international students:
Appletree Bay 2.3 & 3.0 m
Anchorage 4.3 & 4.3 m
this was done approx 1 Km from shore
This will be a great addition to your story about TasBay water... if you know where these places are
AND... Zayon did some readings (1 week later) in Nelson Harbour: 2.1 , 1.8 & 2.0 m
Appletree Bay 2.3 & 3.0 m
Anchorage 4.3 & 4.3 m
this was done approx 1 Km from shore
This will be a great addition to your story about TasBay water... if you know where these places are
AND... Zayon did some readings (1 week later) in Nelson Harbour: 2.1 , 1.8 & 2.0 m
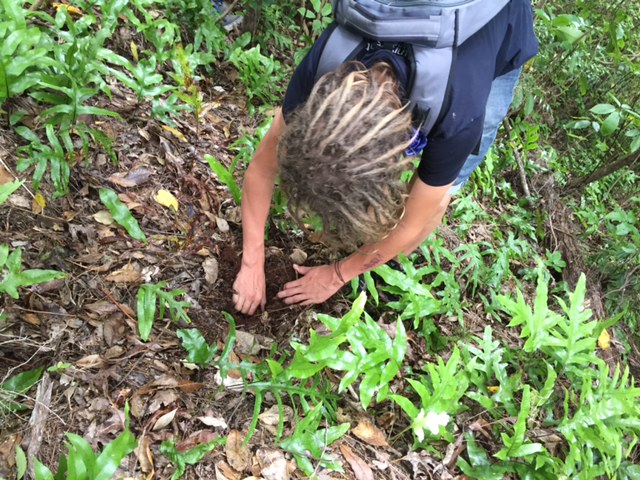
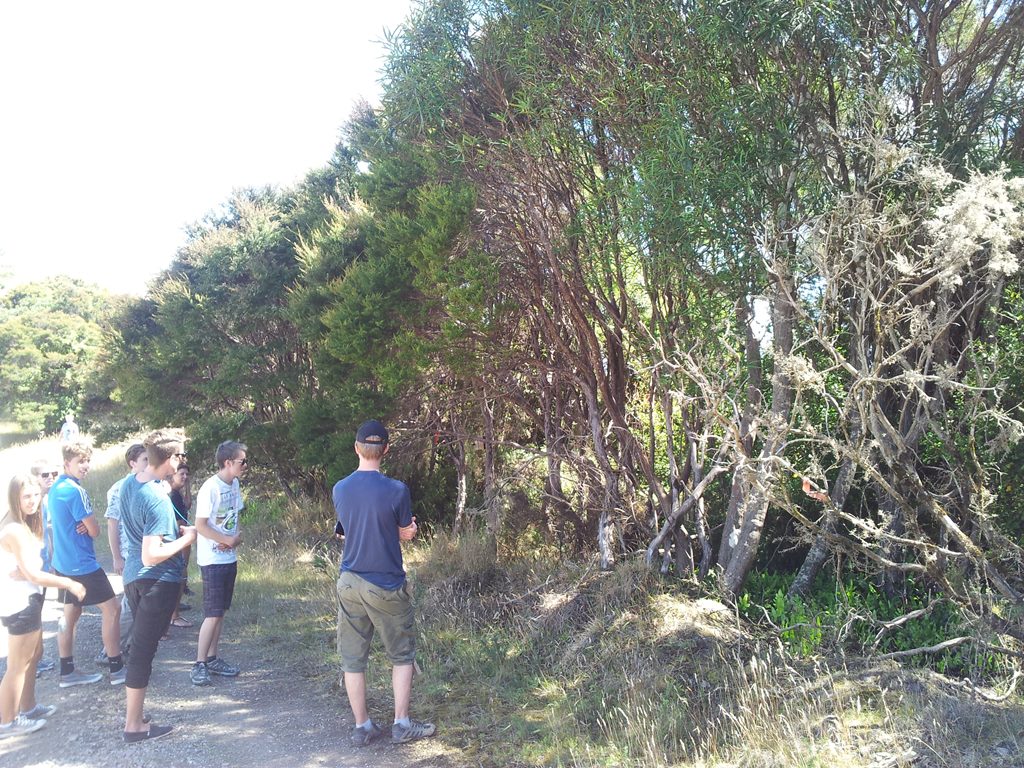
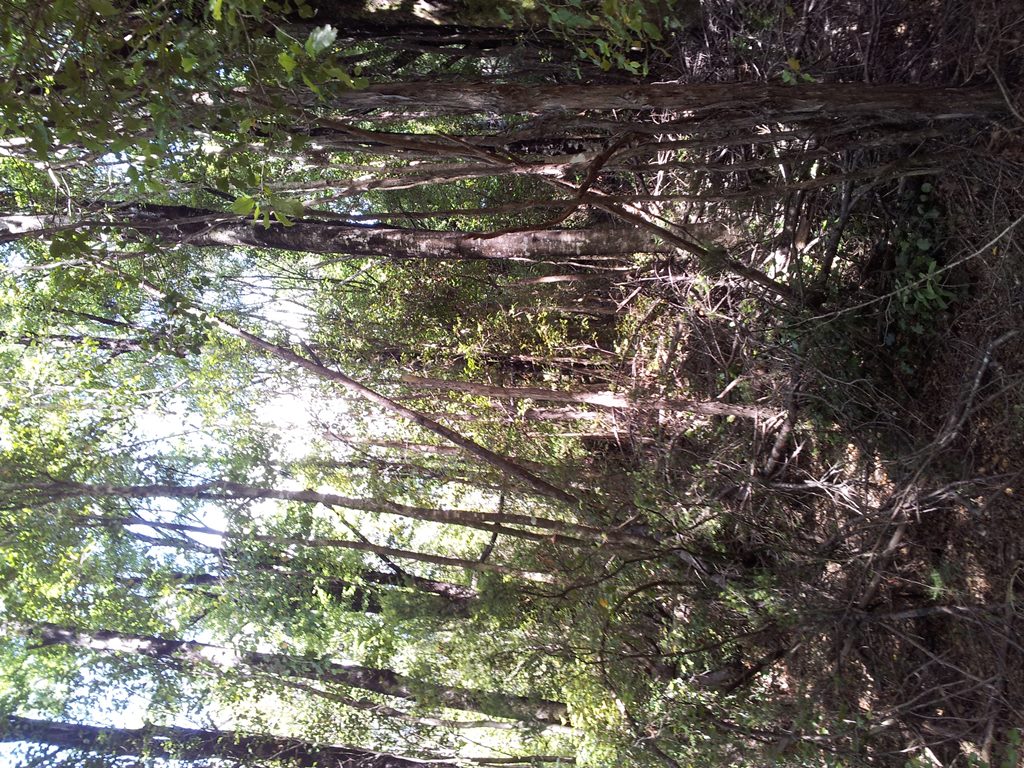
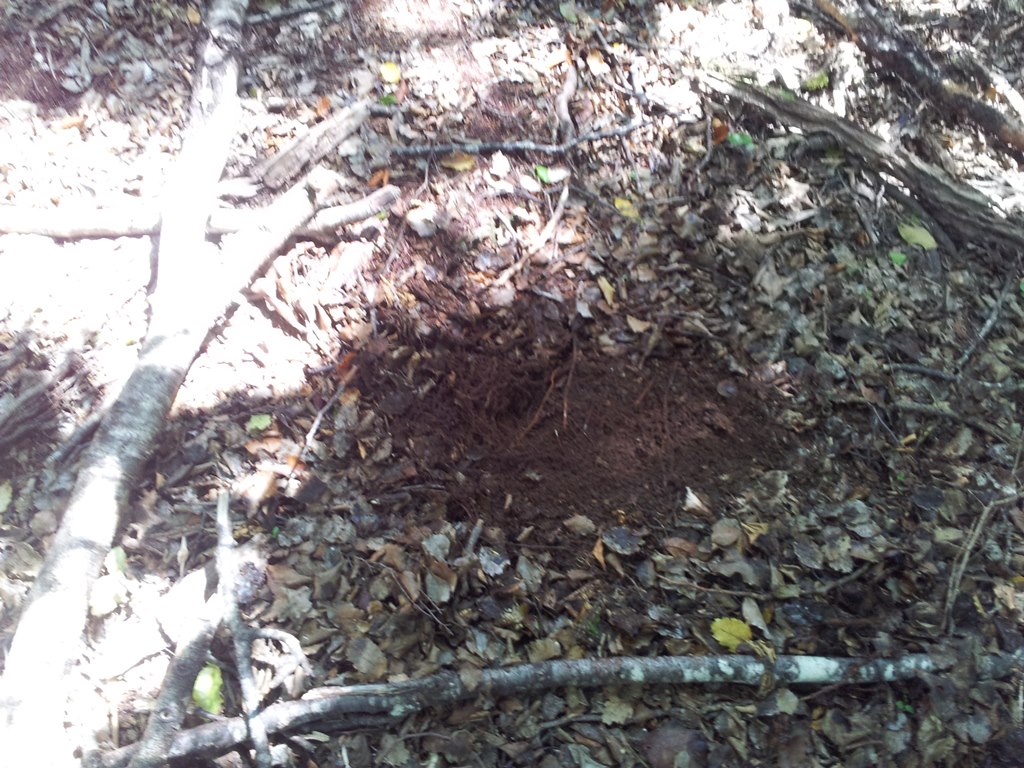
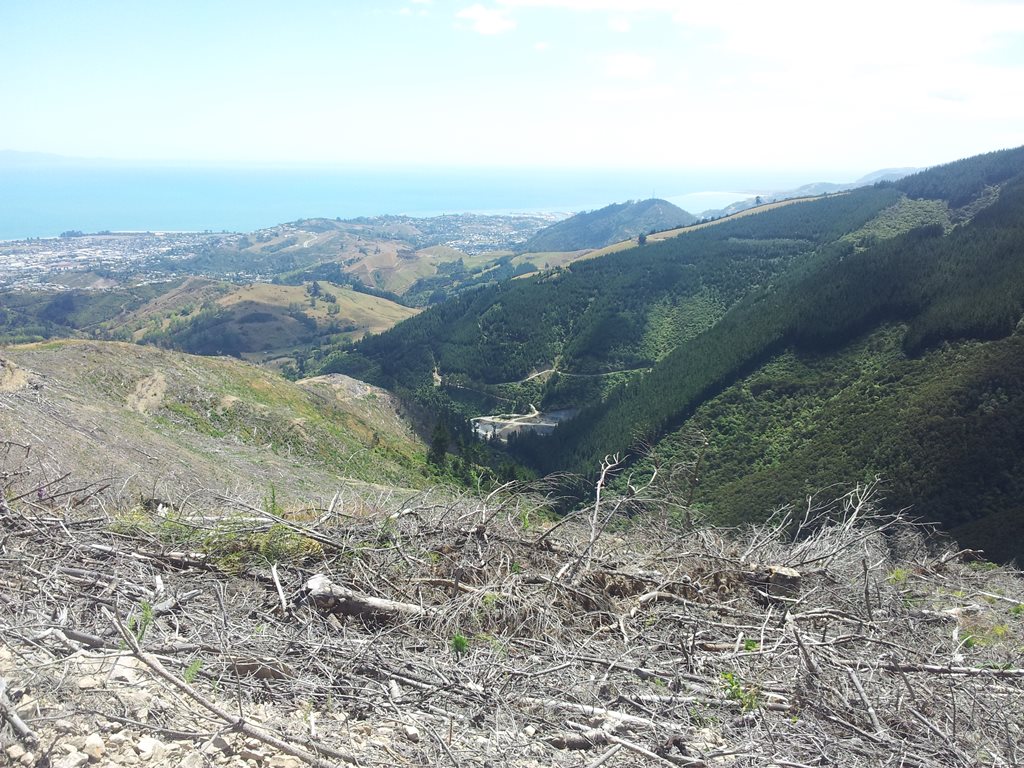
Trip up Marsden Valley, Feb. 2018
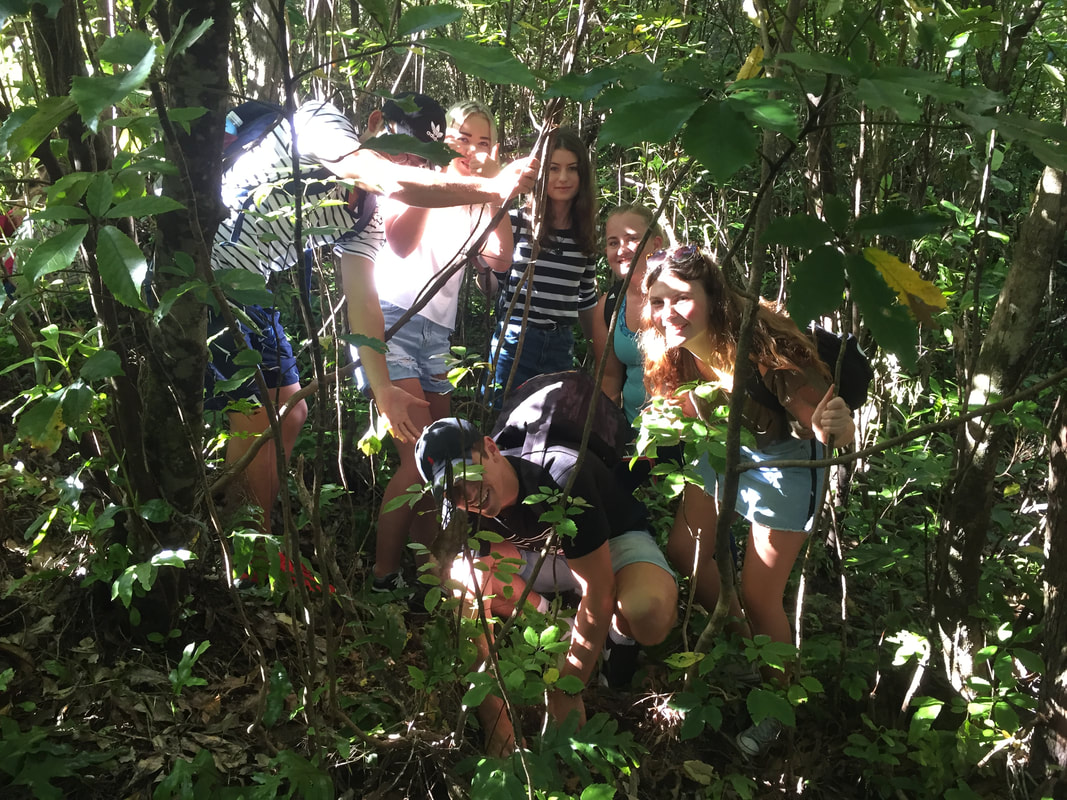
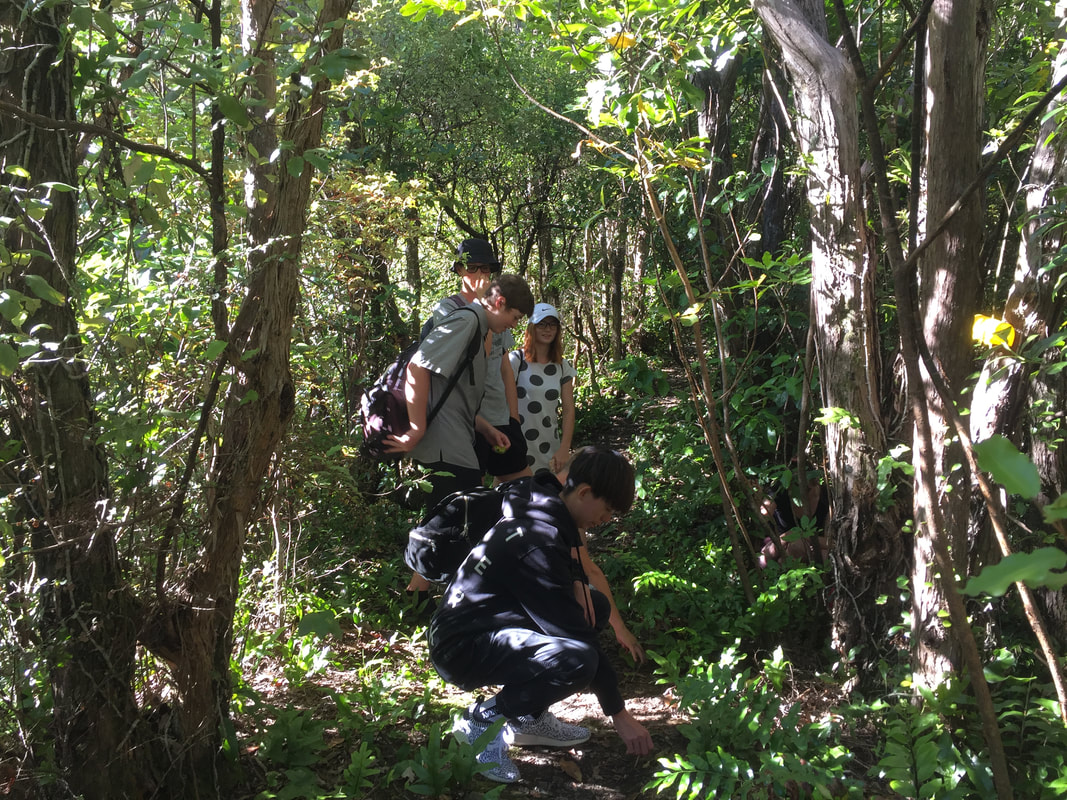
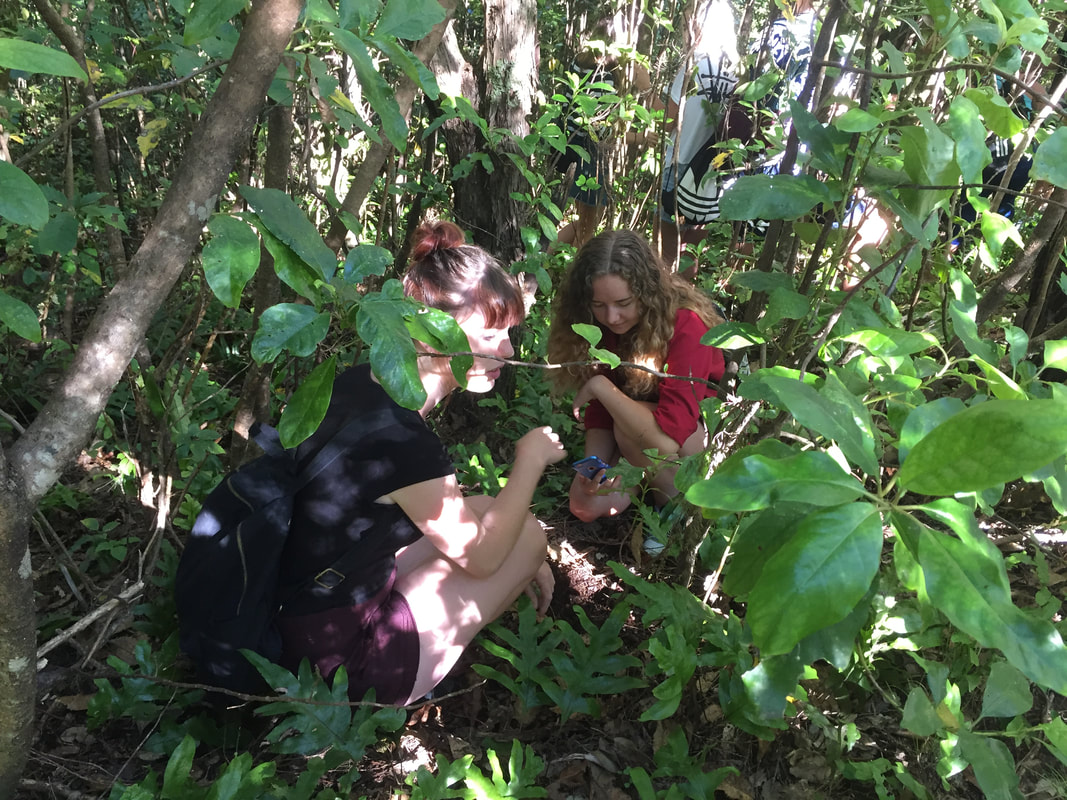

Digging in native forest (thru humus layer), ground following logging, and us!
TasBay Trip, March 1, 2018
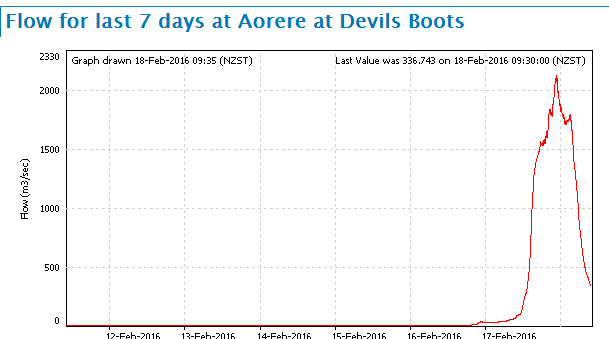
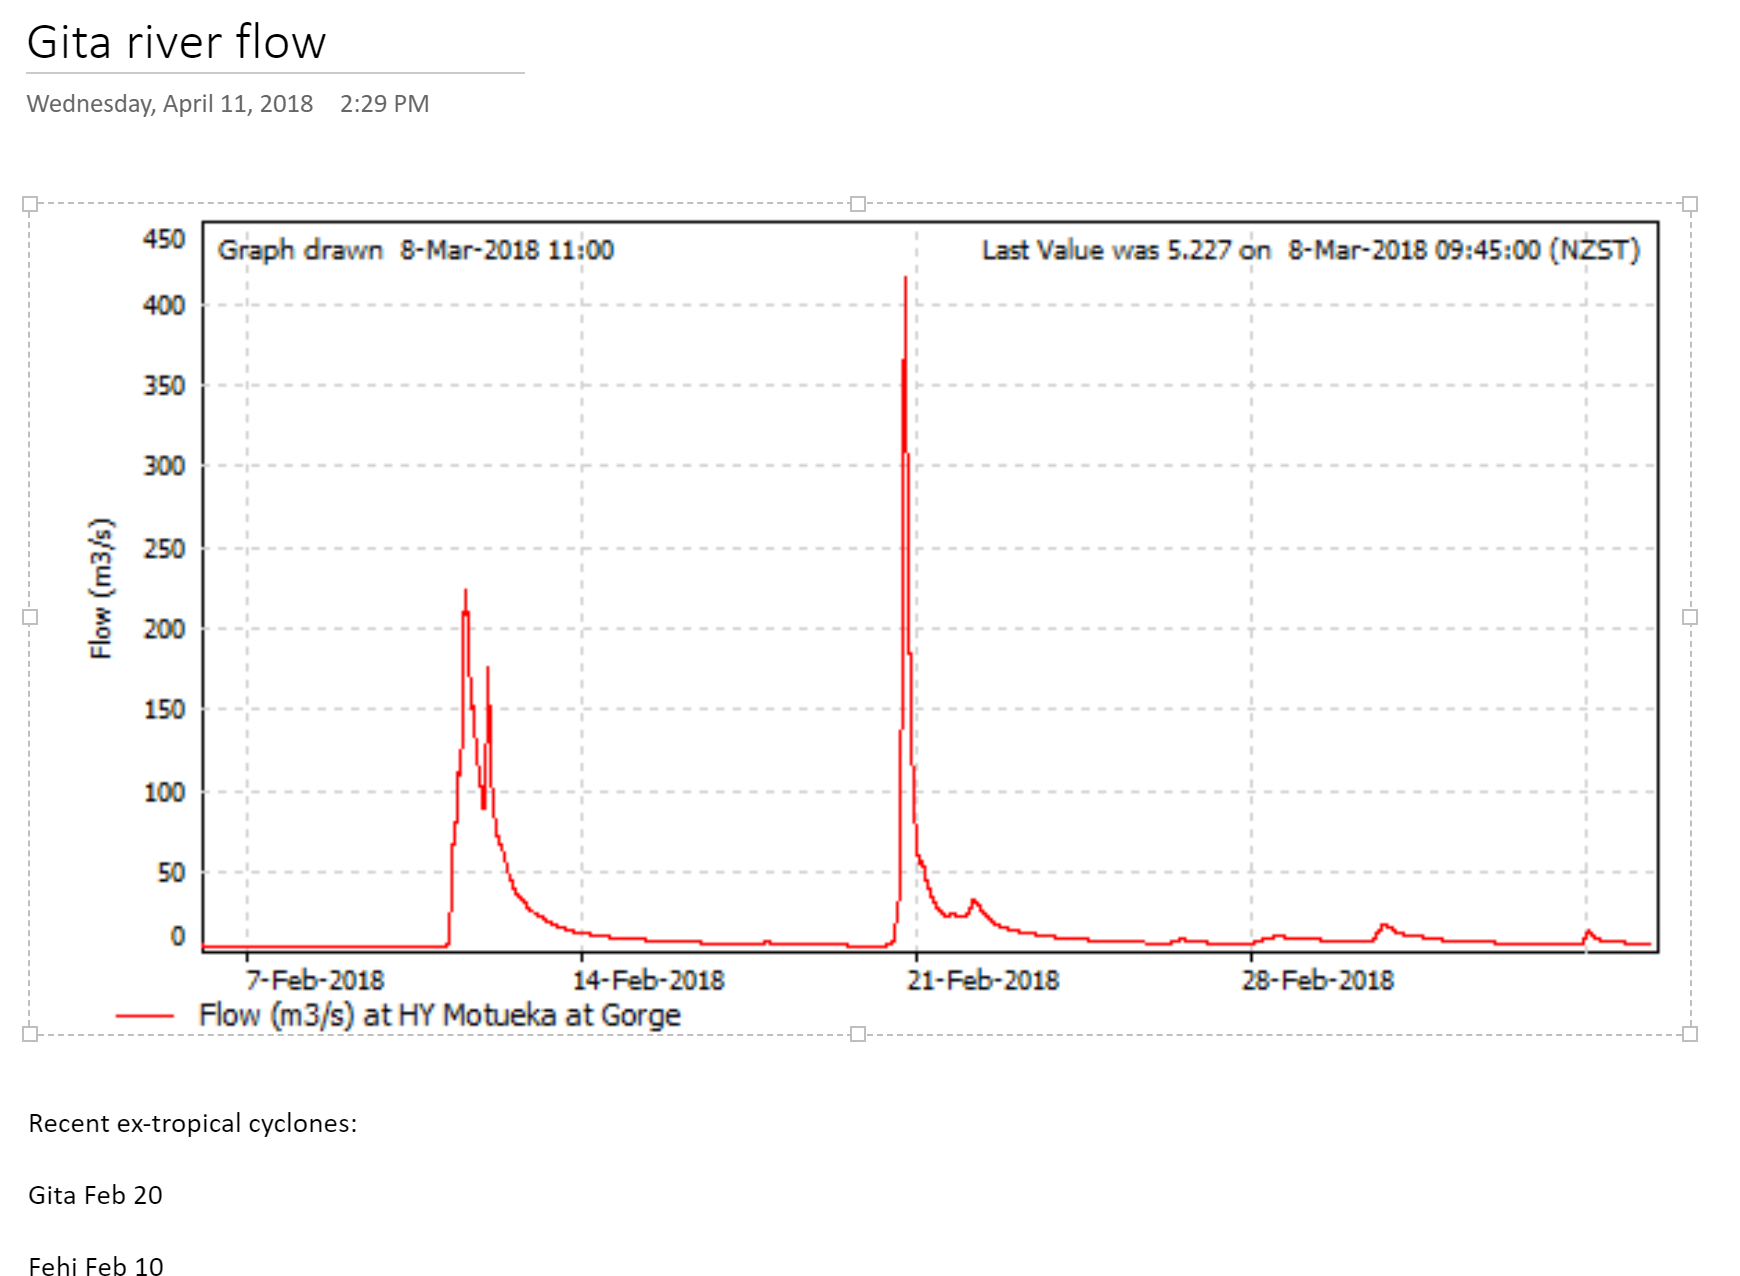
TDC Riverflow after Gita
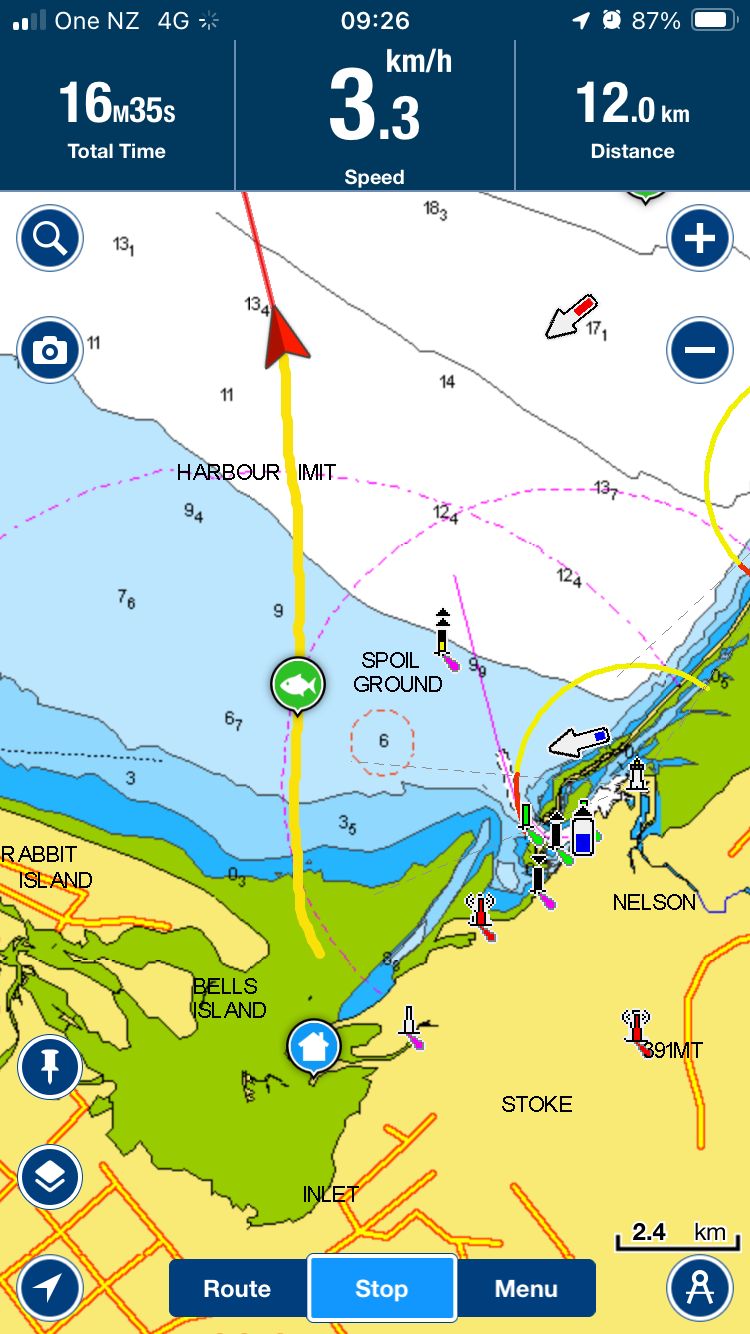
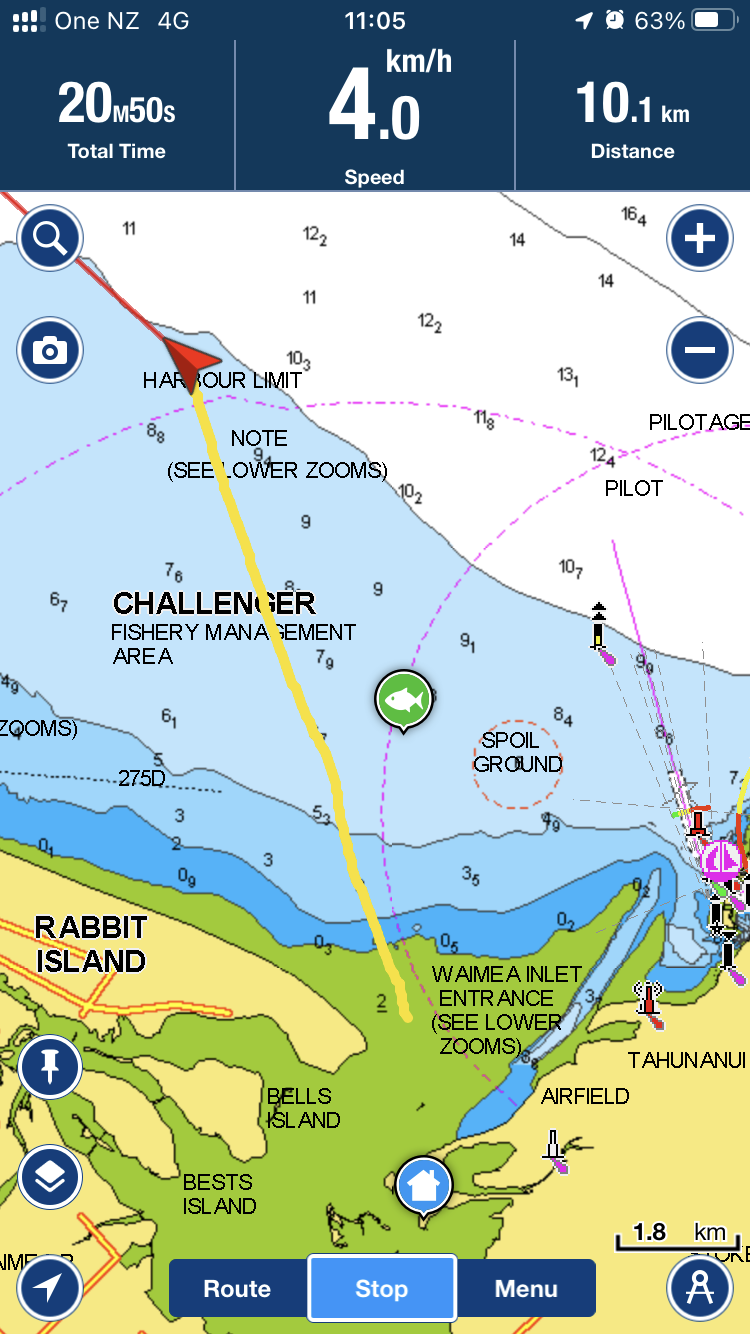
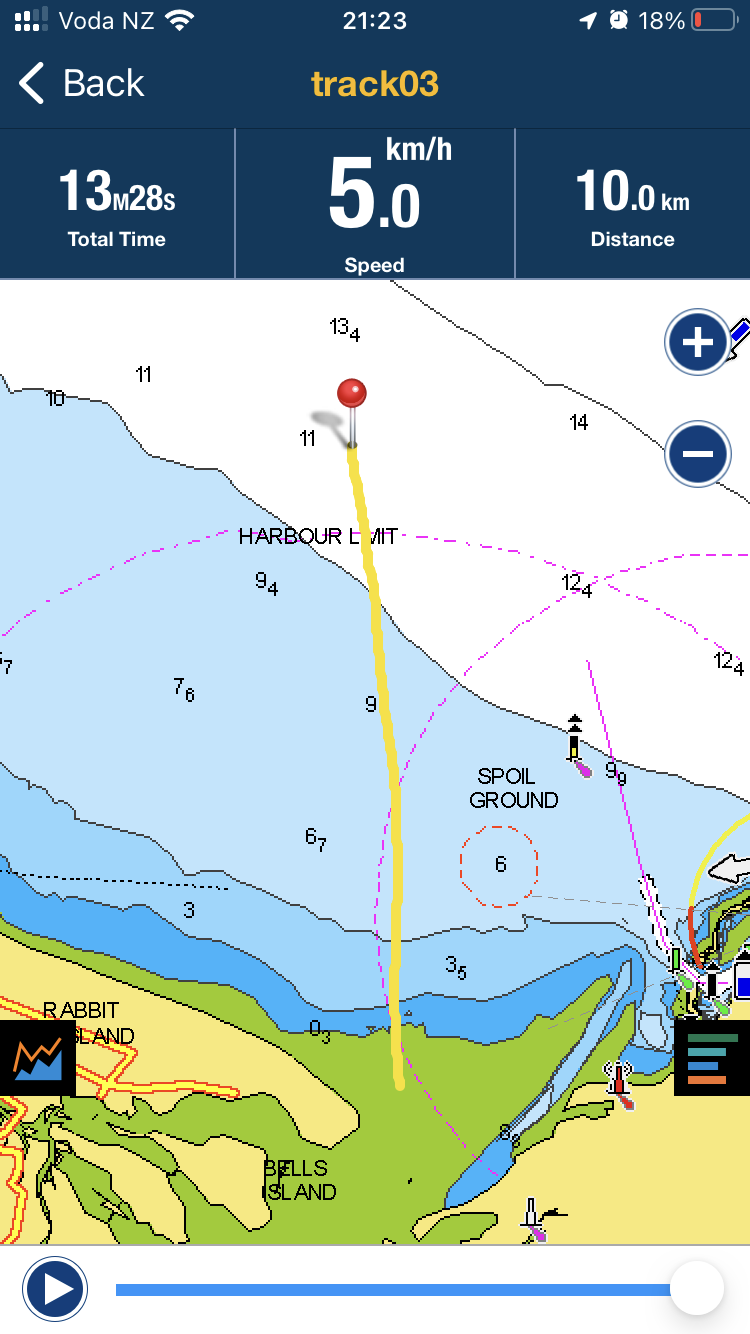
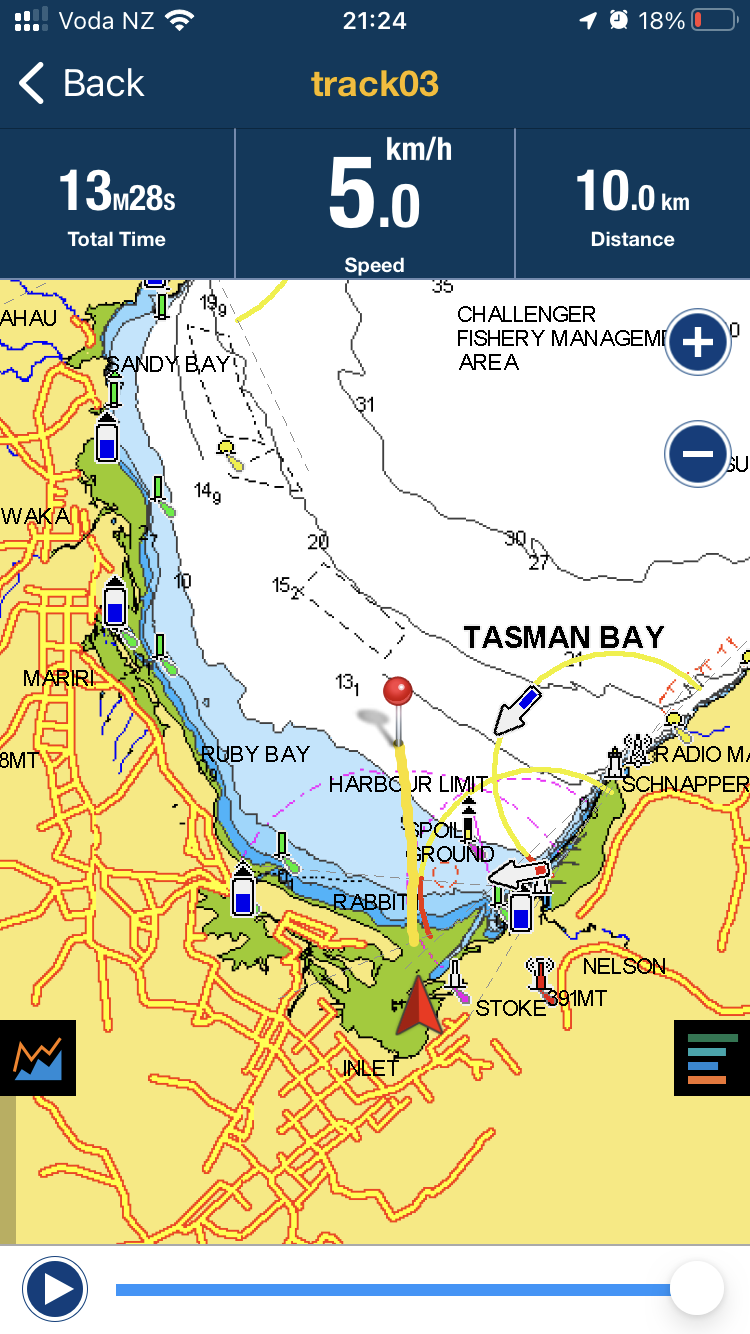
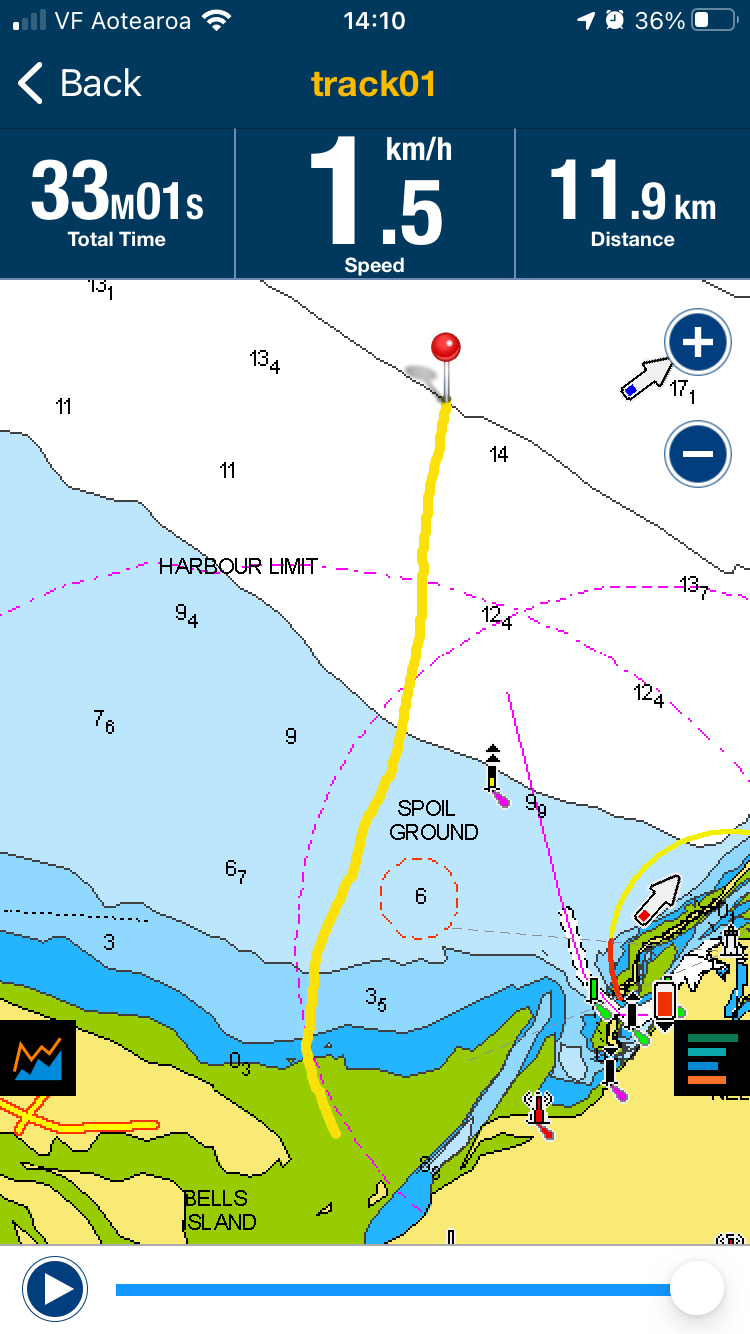
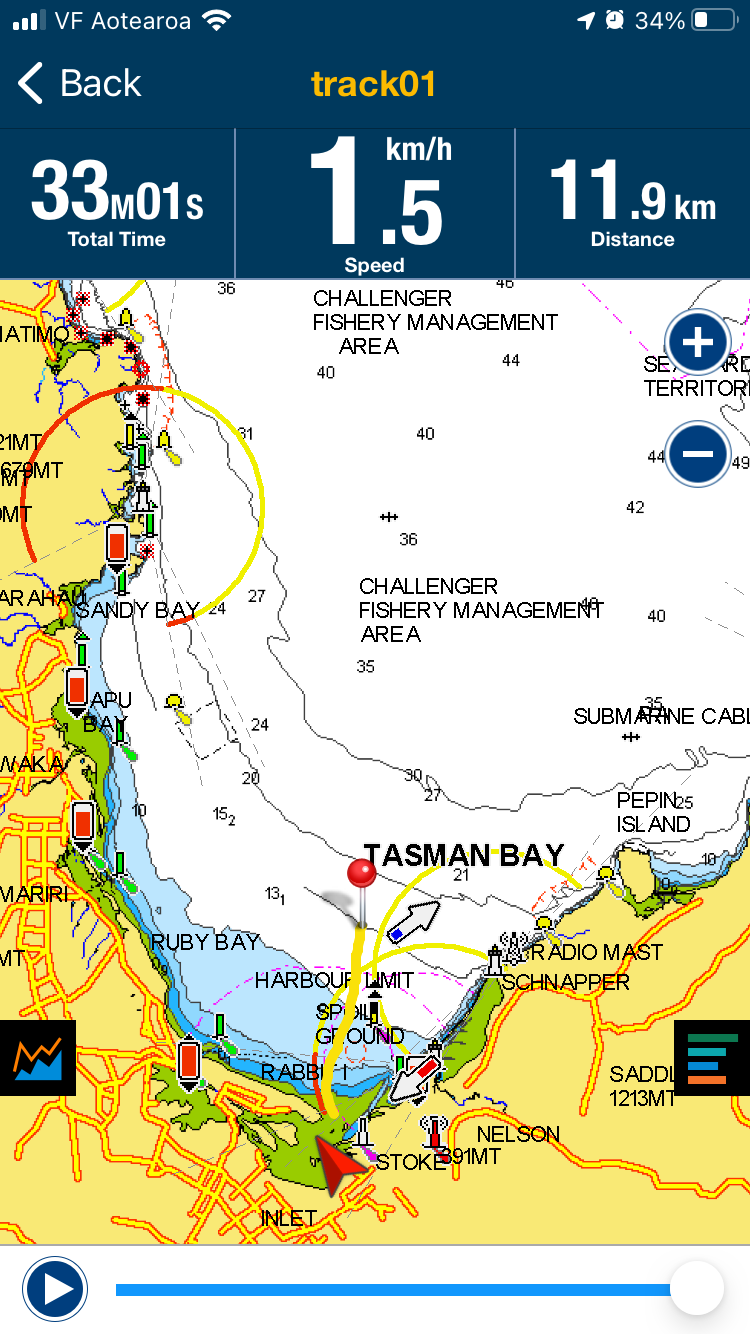
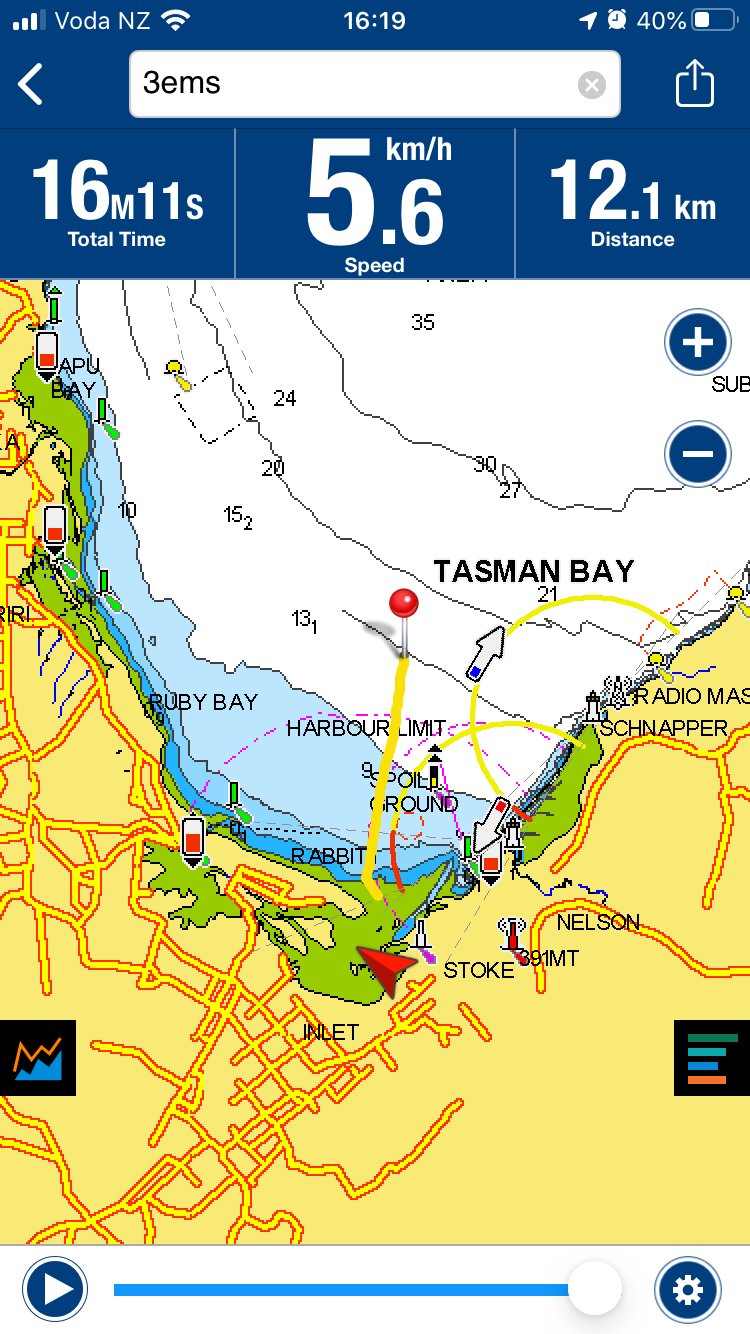
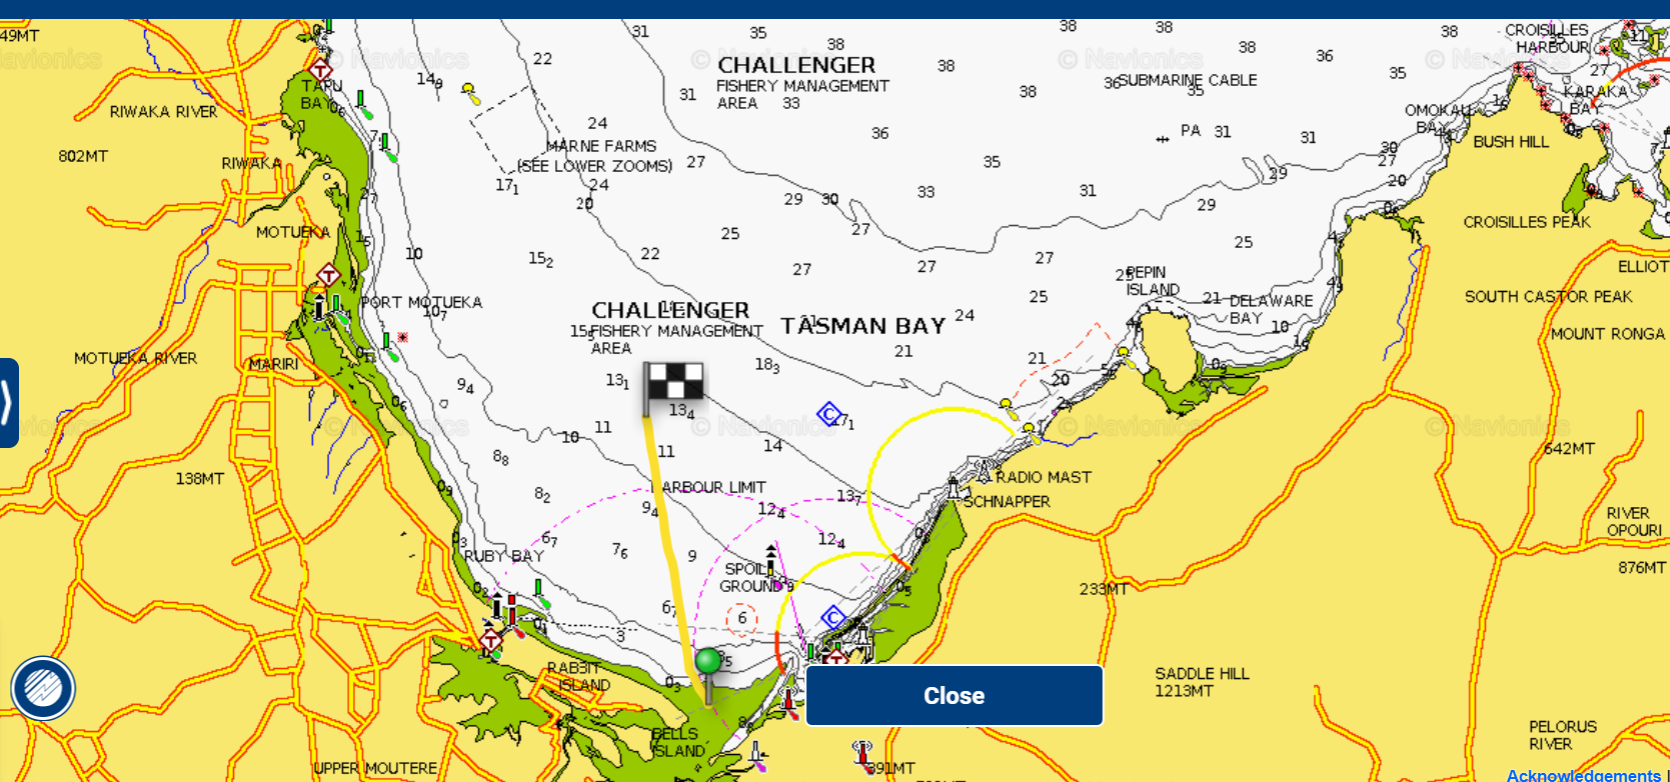
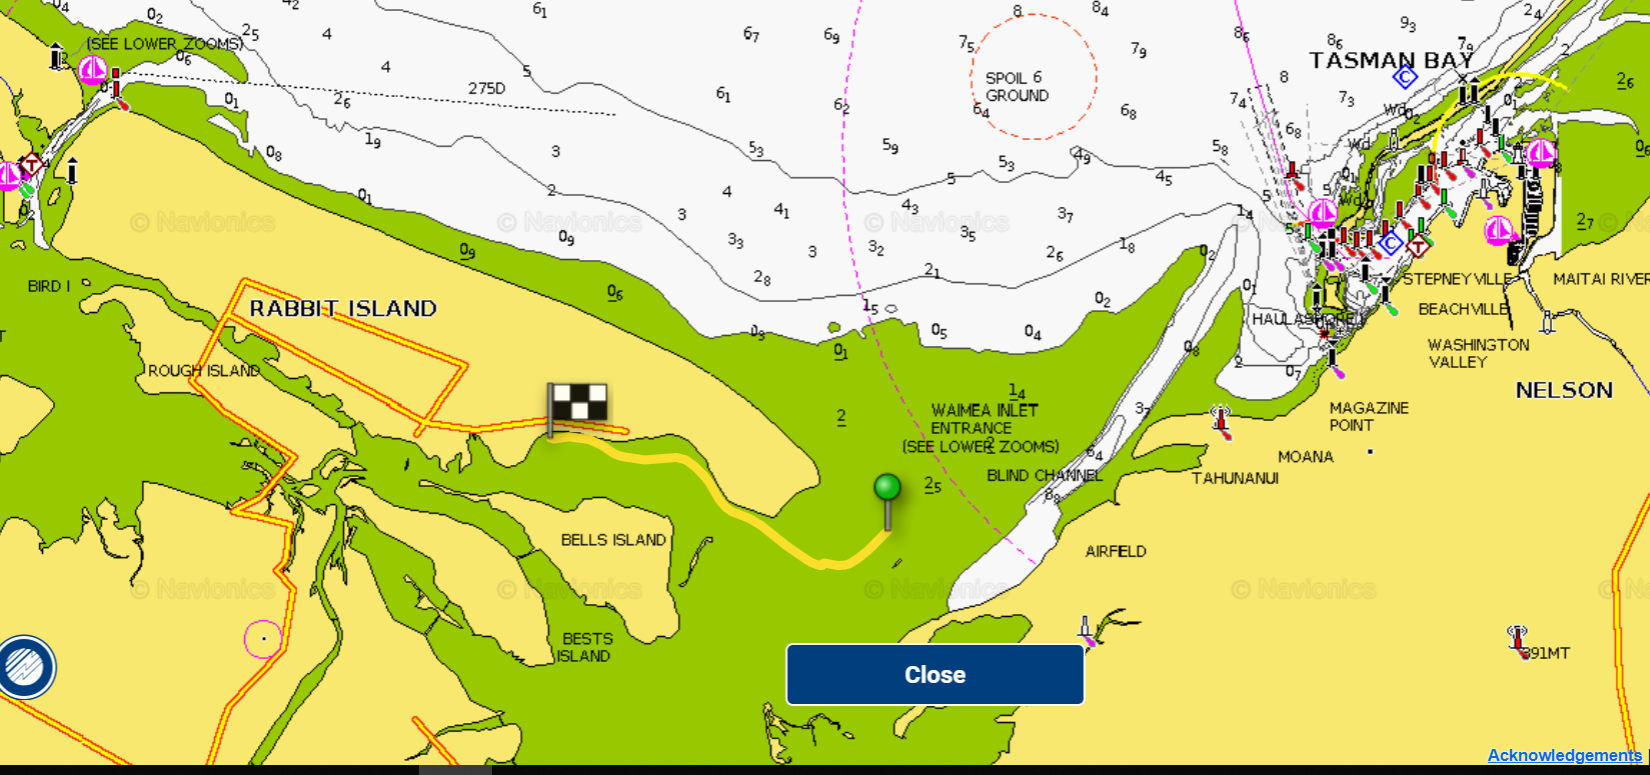
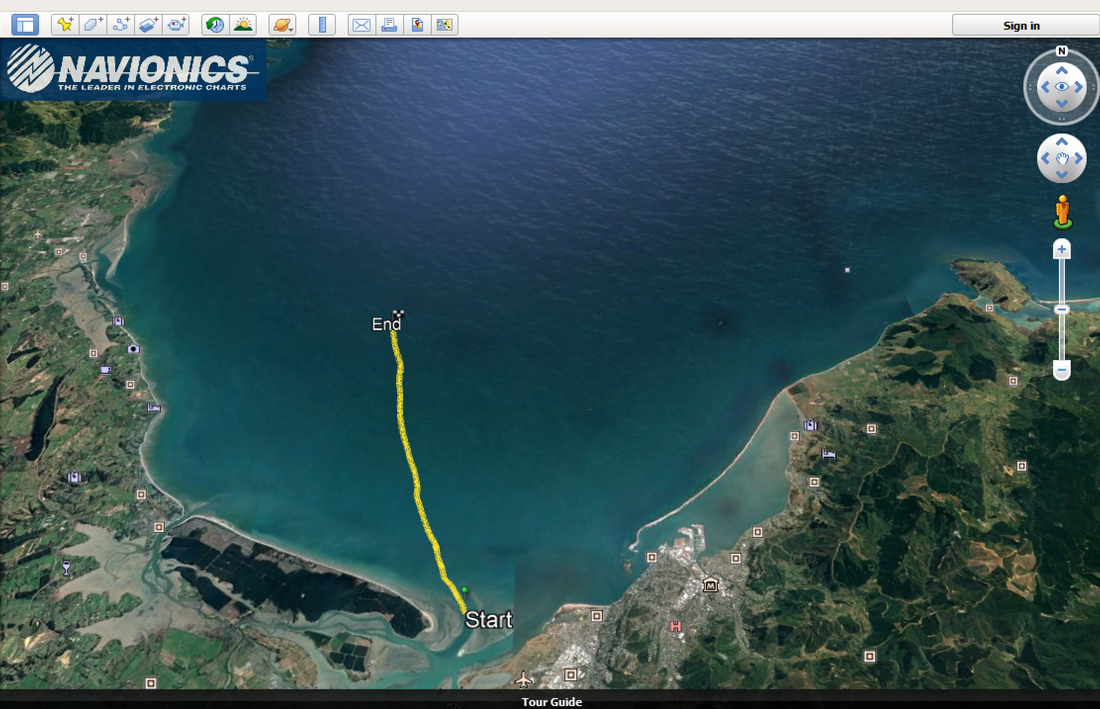
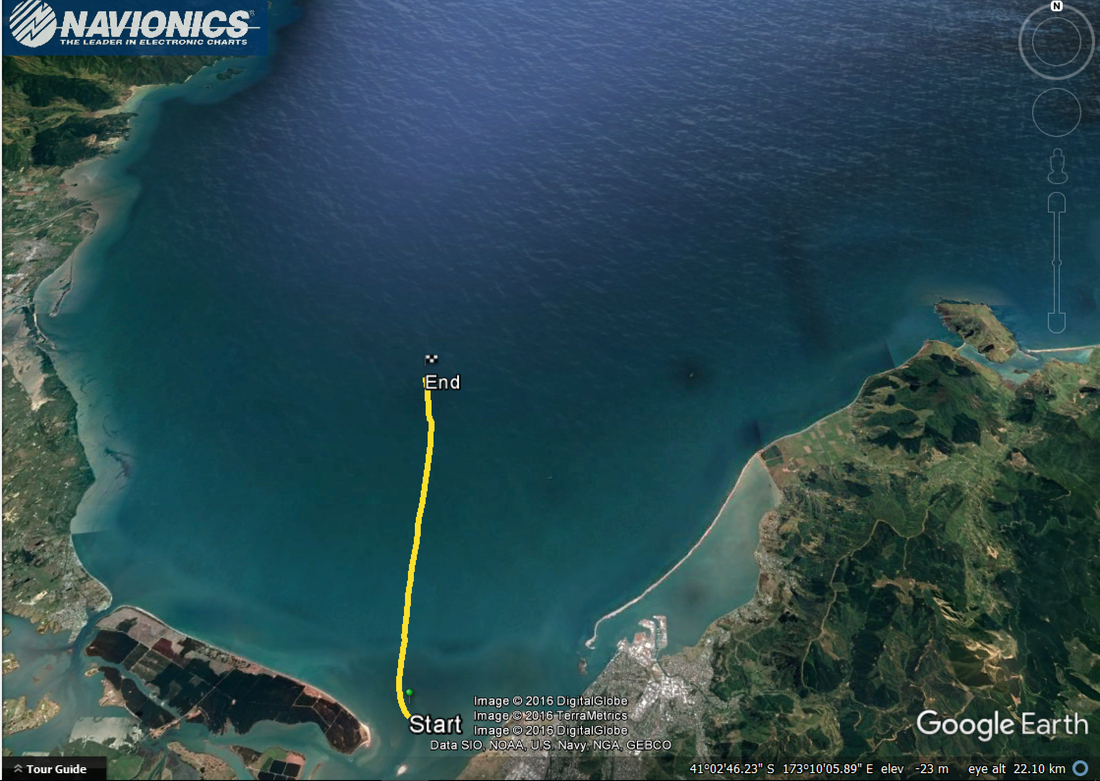
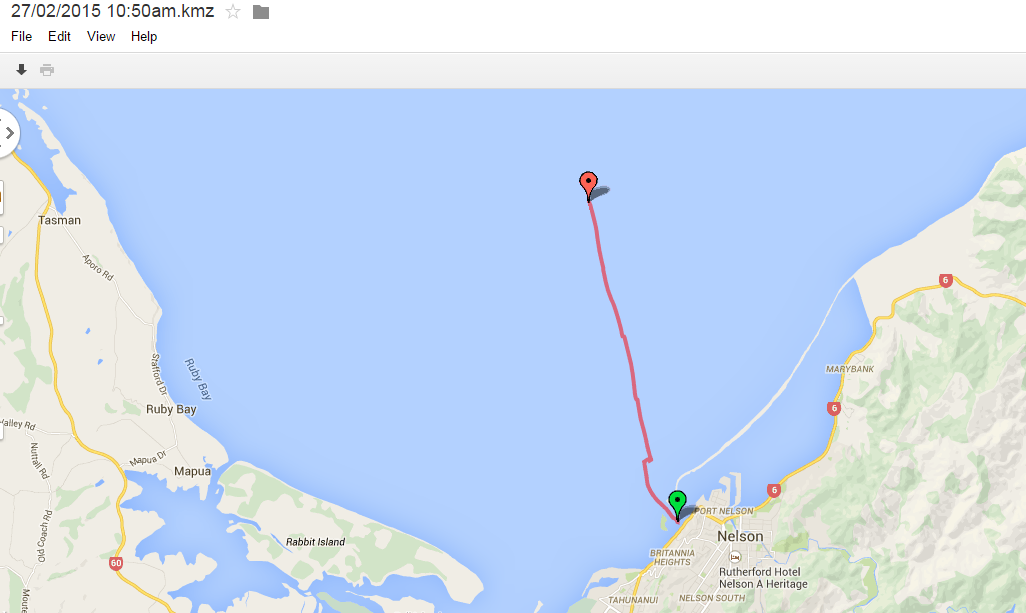
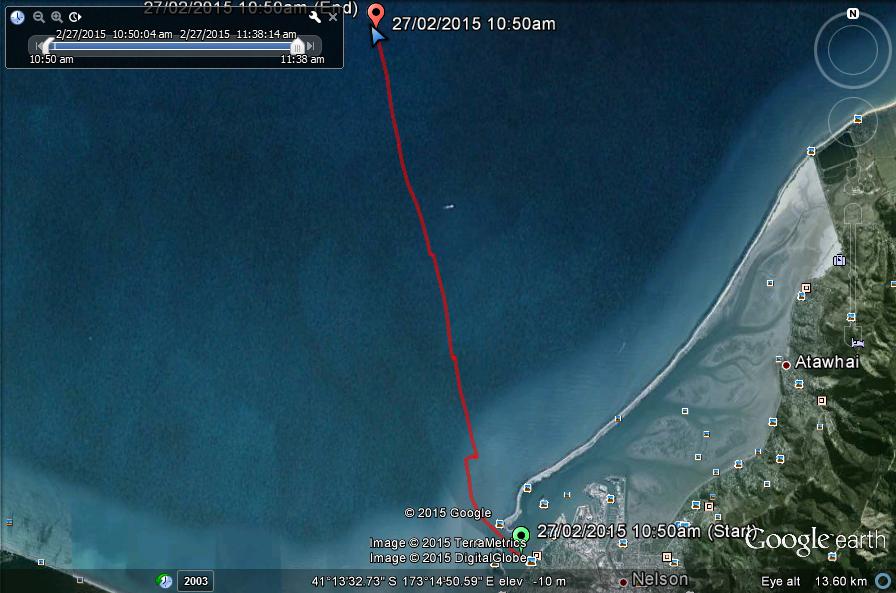
Track recorded with Navionics App.
View it: http://tinyurl.com/y9z3xshc
Download it: http://tinyurl.com/y8gq8qgj
Track recorded with Navionics App.
View it: http://tinyurl.com/y9z3xshc
Download it: http://tinyurl.com/y8gq8qgj
Tasman Bay trip 2017 (March 2)
Track recorded with Navionics App.
View it: http://tinyurl.com/z82enwm Download it: http://tinyurl.com/jplq3st |
|
From CoA on TKI.....
Planning, collecting raw data, processing, interpreting, and evaluating may be undertaken in small groups but the teacher needs to ensure that there is evidence that each student has met all aspects of the standard.
What does this mean for you?.... can you just copy work that others have done?
Planning, collecting raw data, processing, interpreting, and evaluating may be undertaken in small groups but the teacher needs to ensure that there is evidence that each student has met all aspects of the standard.
What does this mean for you?.... can you just copy work that others have done?
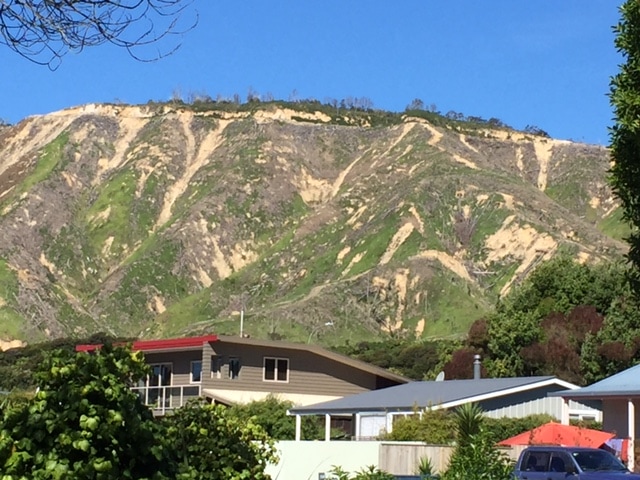
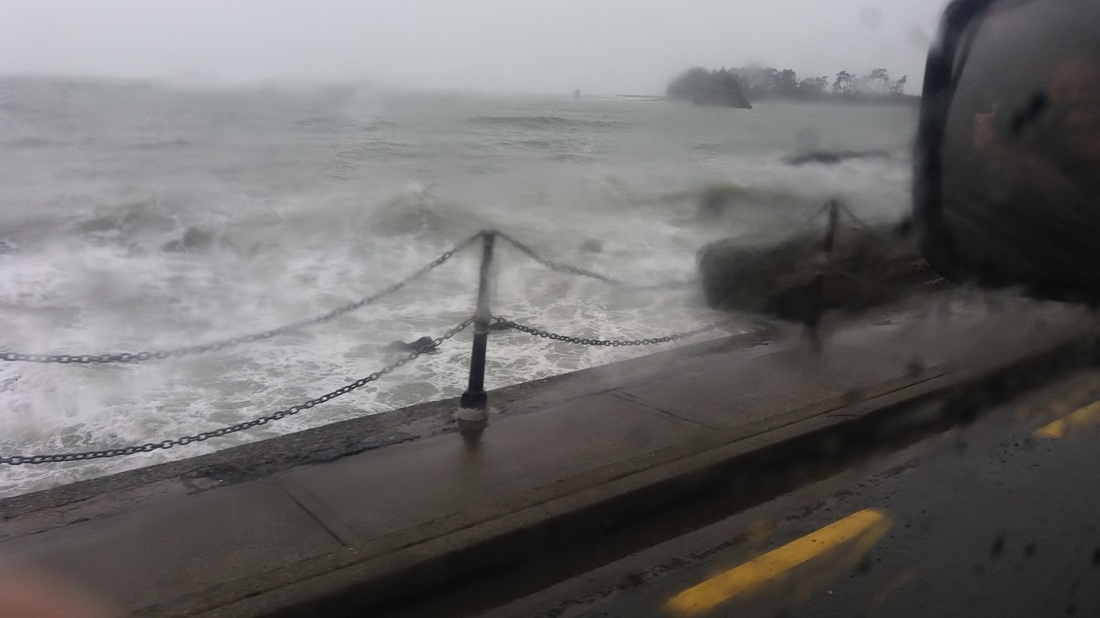
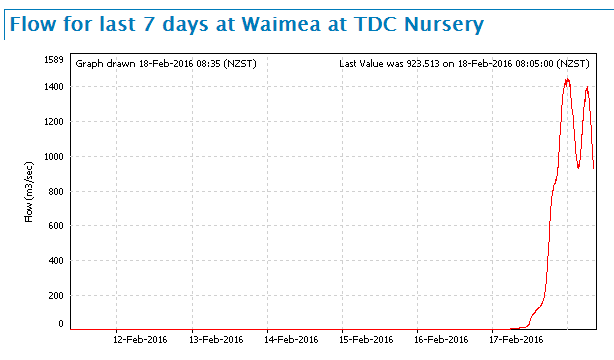
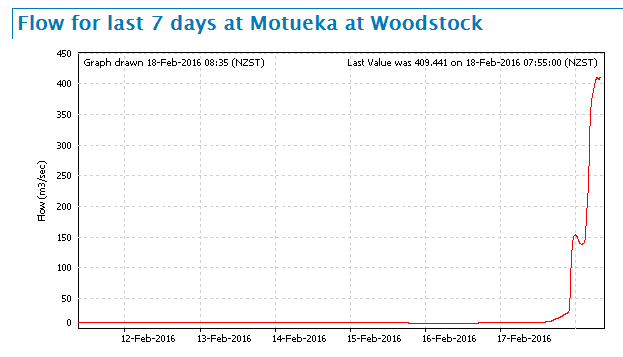
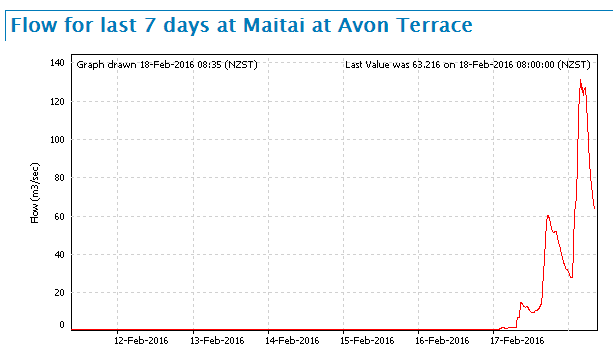
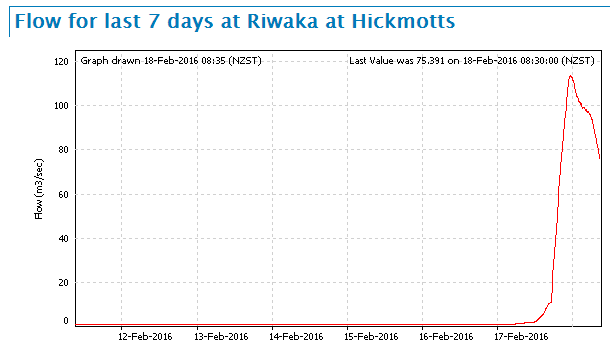
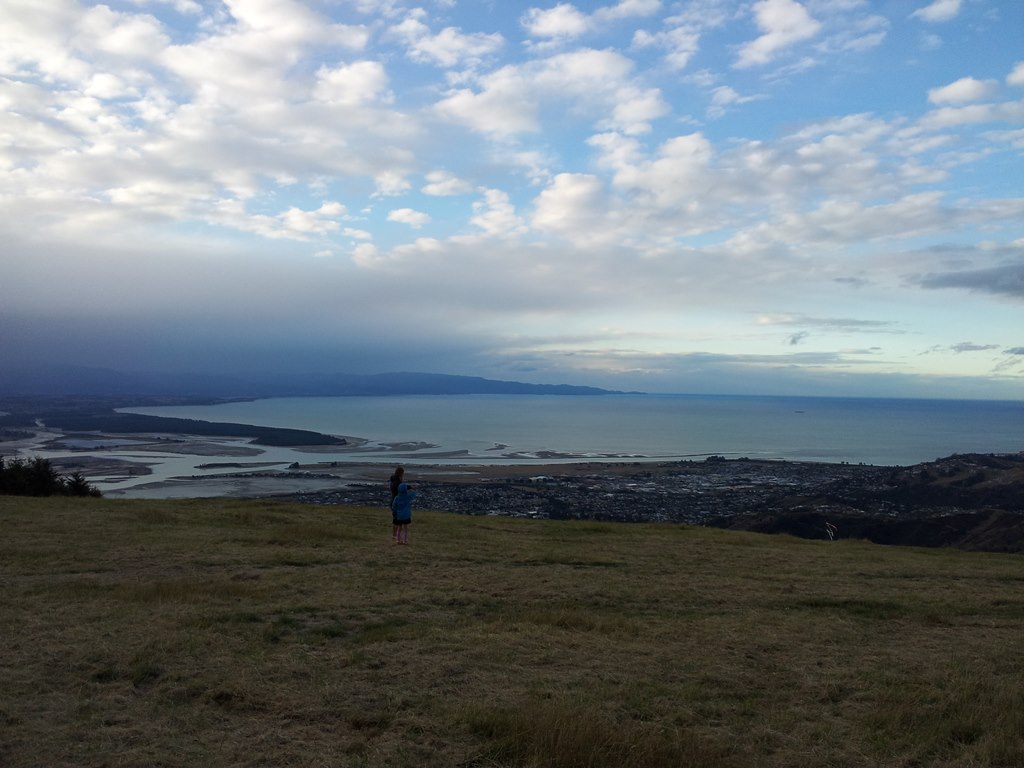
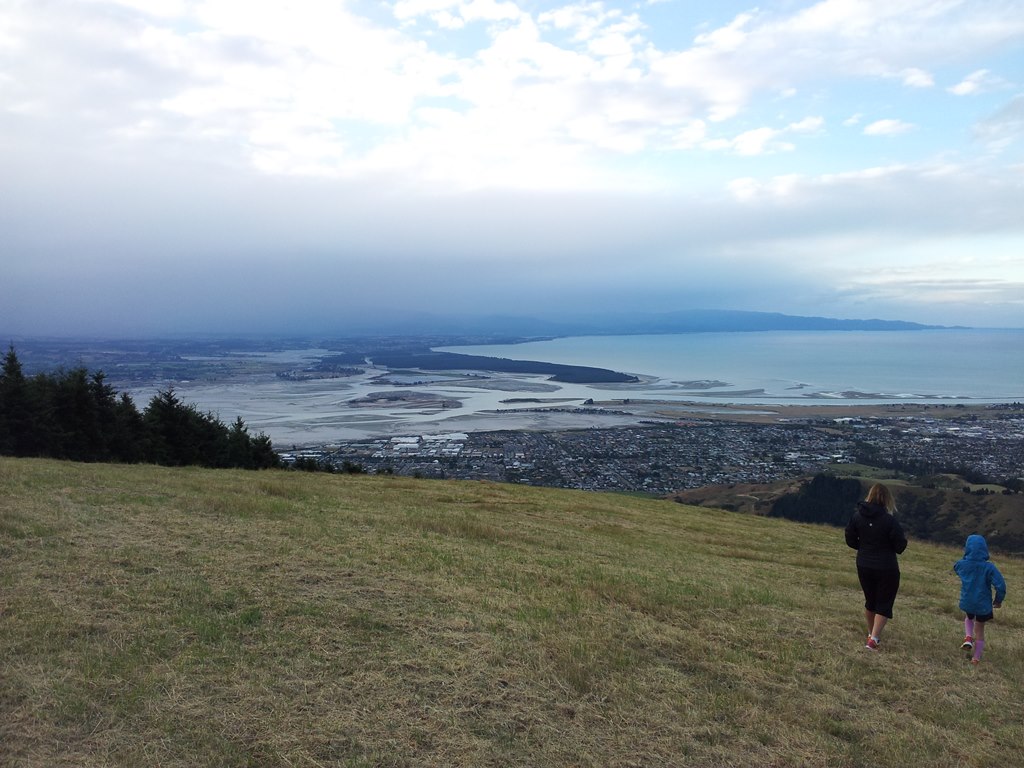
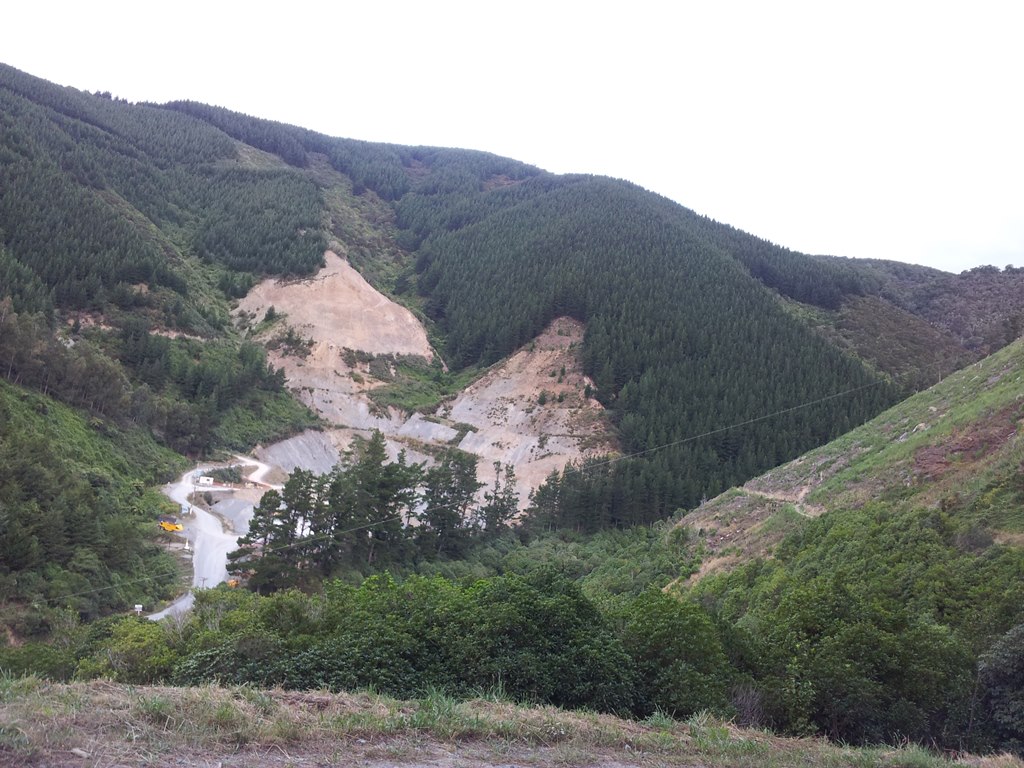
Trip up Barnicoat Feb. 2016
It's all about landuse in the Tasman Bay catchment... what would happen in a heavy rain?
Afterthought... what DID happen in the heavy rain a few days later!!
|
|
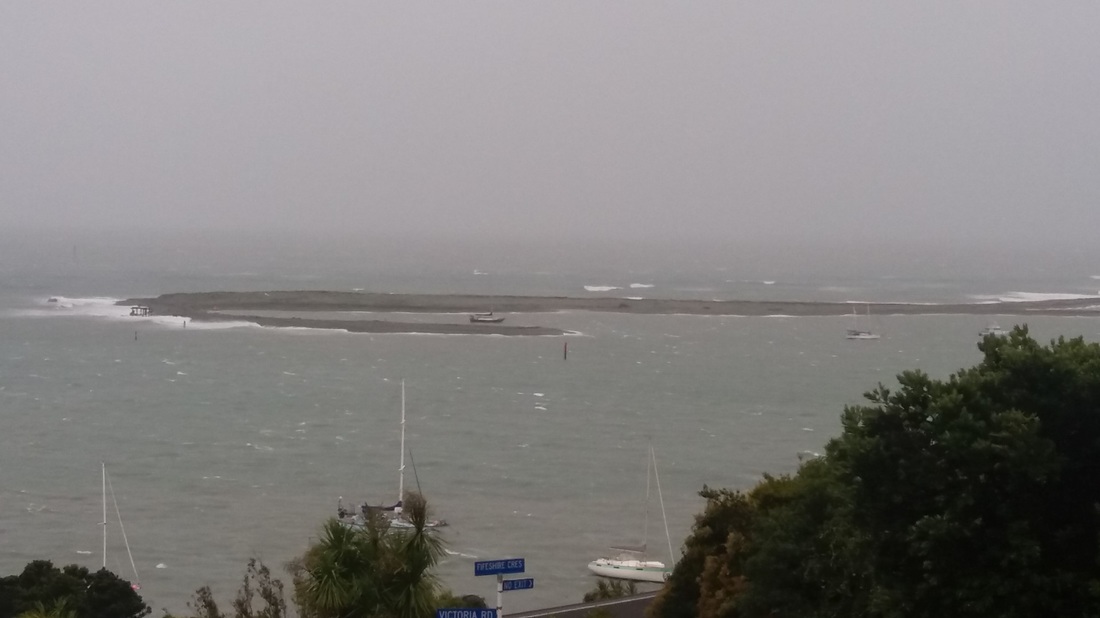
Feb 18... nice big storm How convenient was that!! Words like: erosion, sediment, wind, waves, re-suspension should come to mind |
|
A week after the storm words to pop into your mind: Waimea river & estuary, salt wedge, fine sediment, transport |
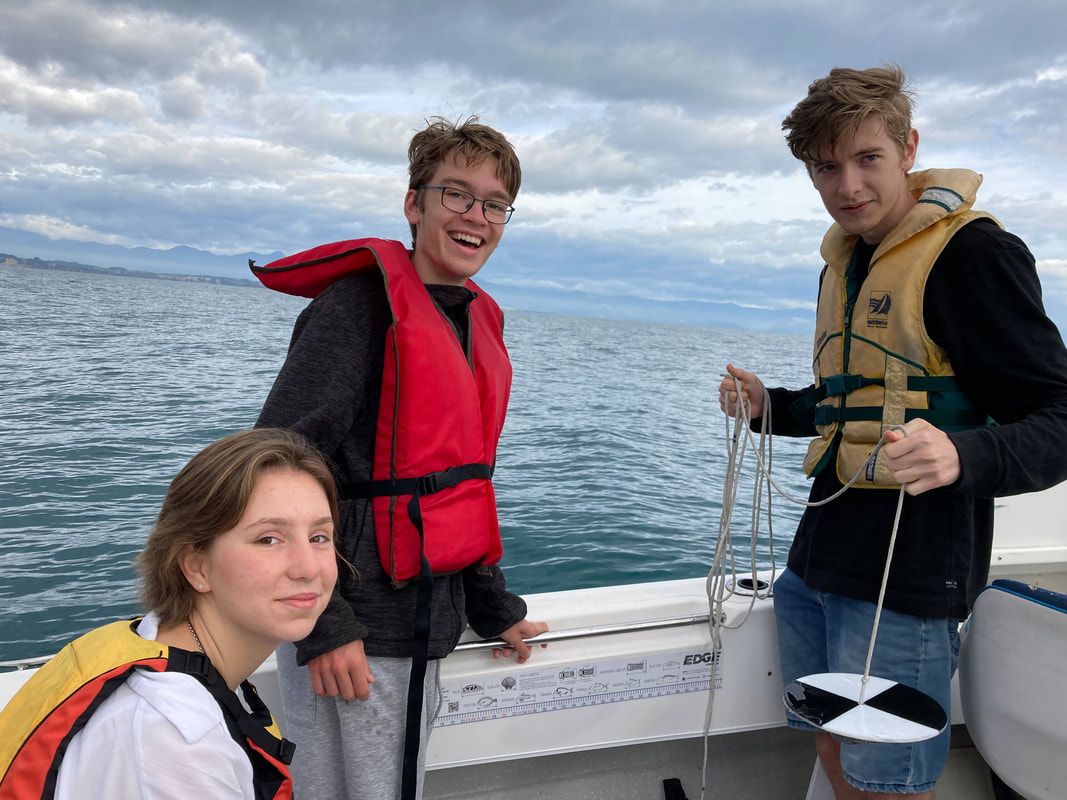
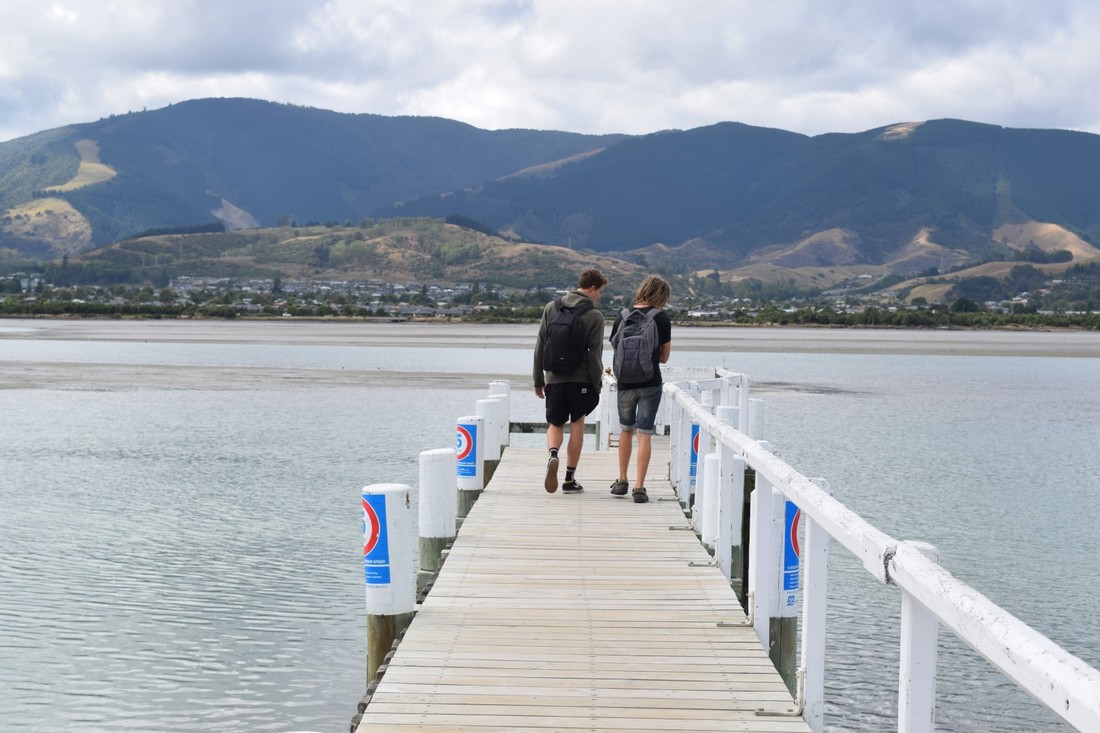
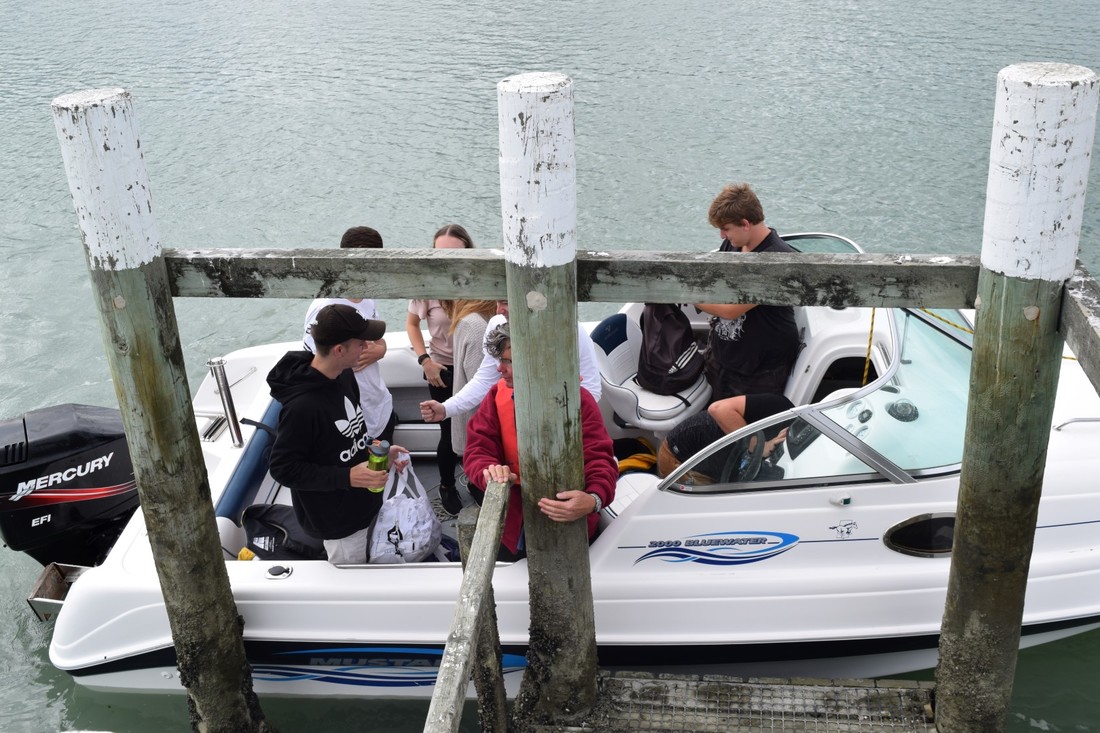
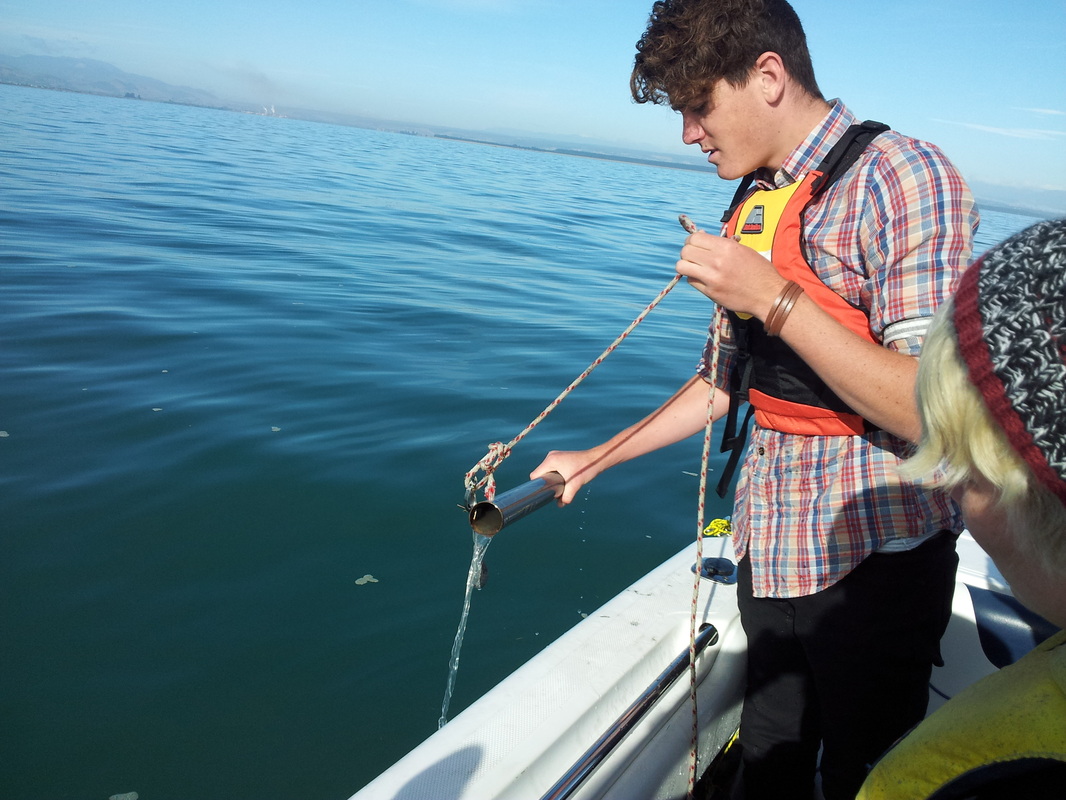
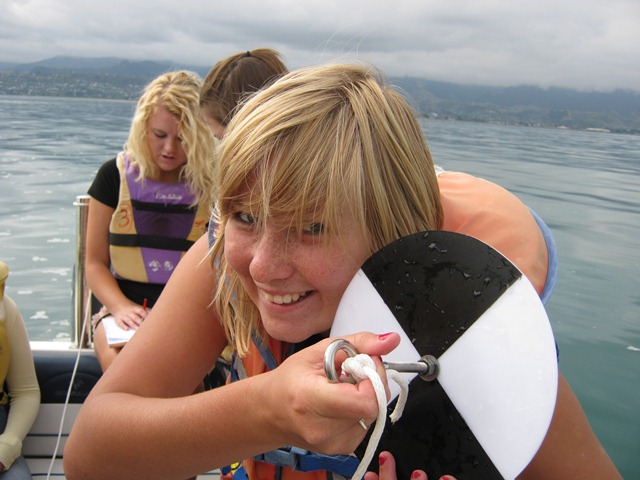
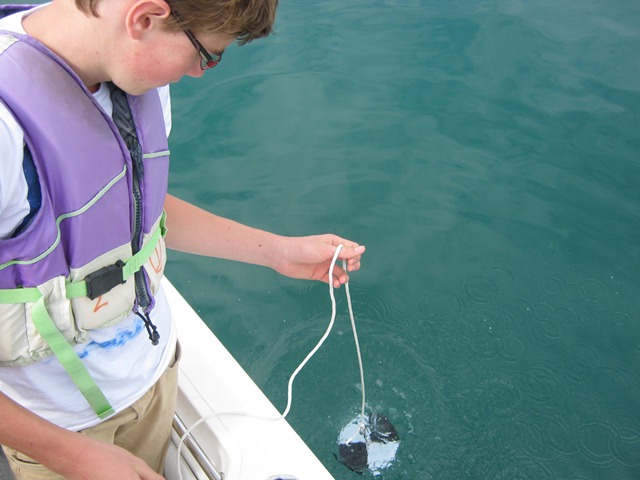
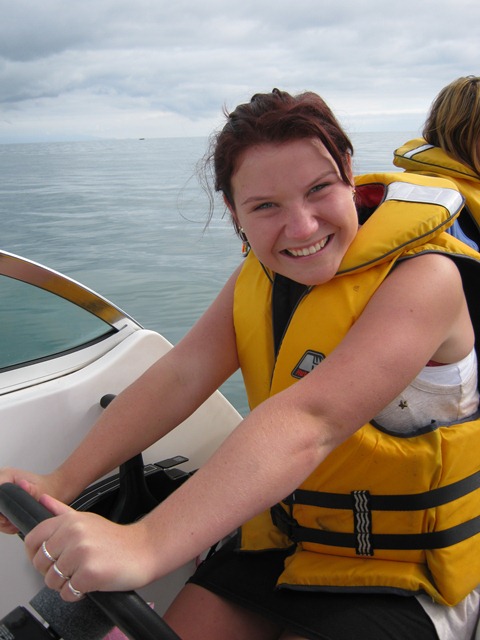
Field work: Tasman Bay trip - March 7, 2016
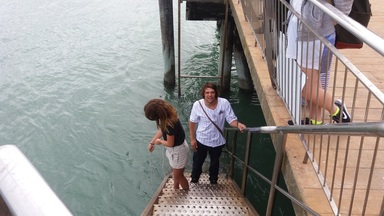
What a bunch of superstar scientists... & no-one was seasick!
|
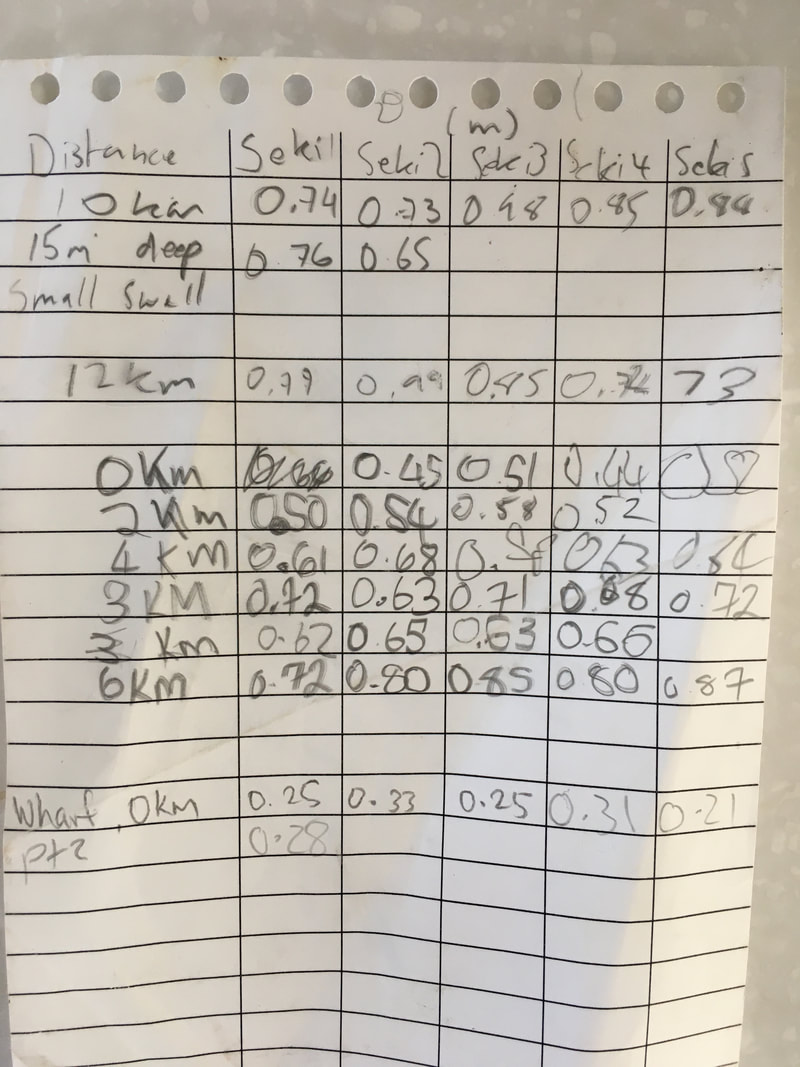
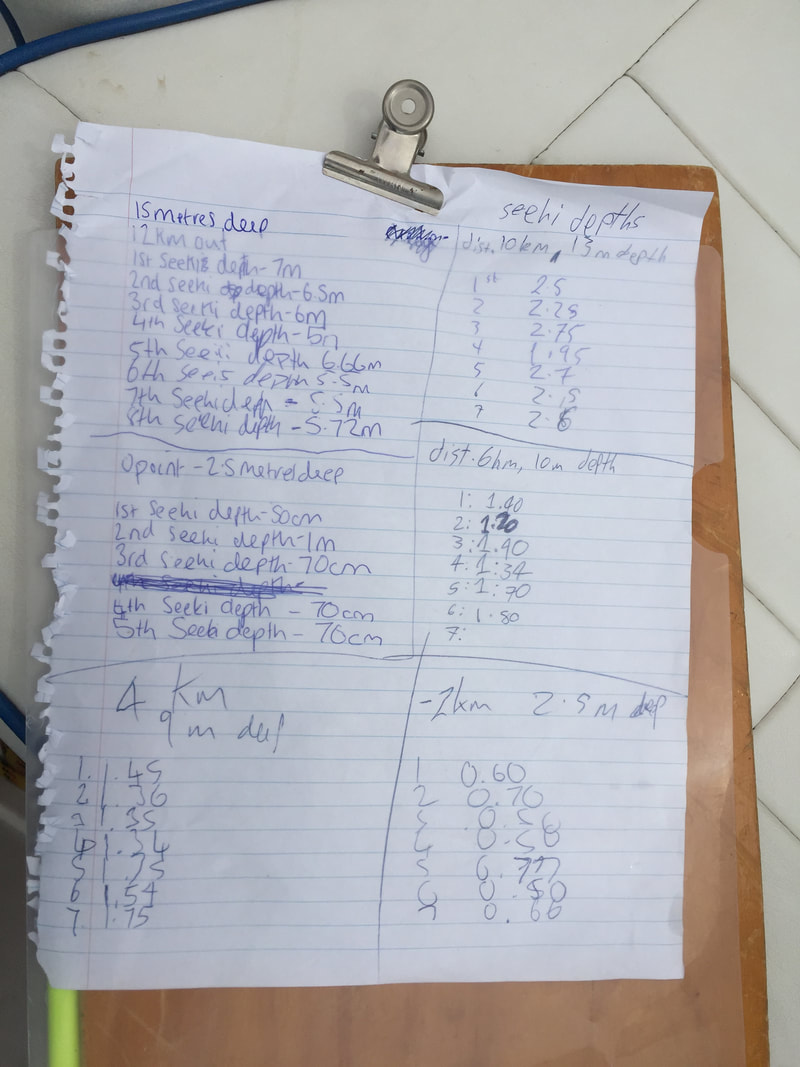
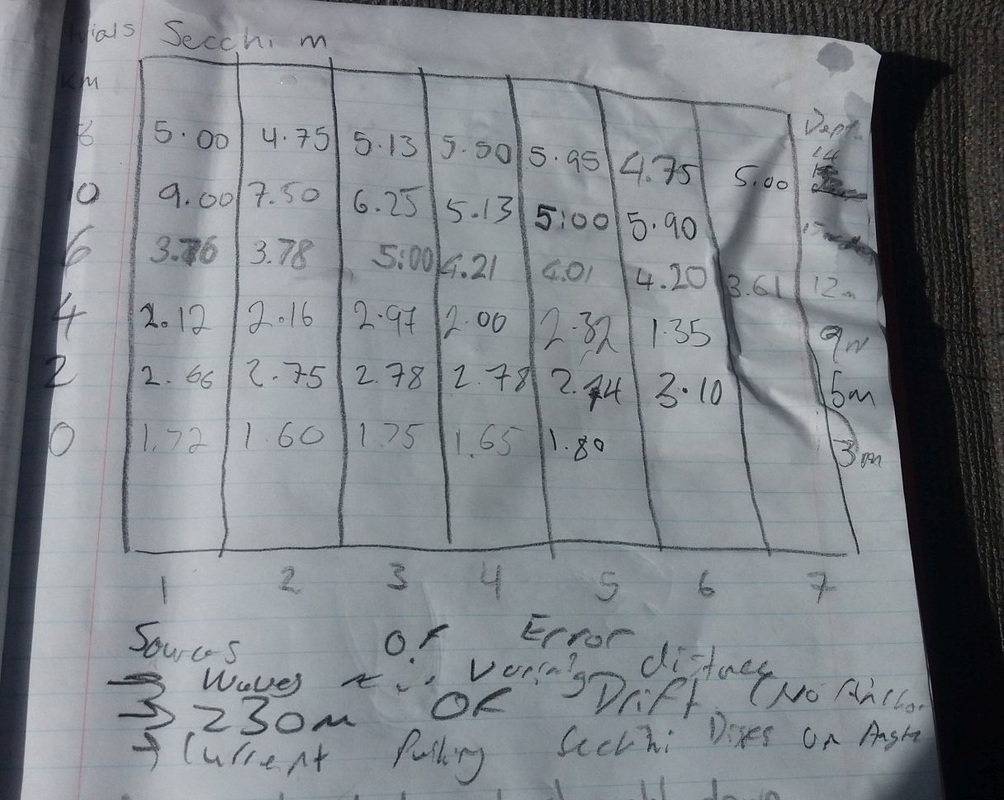
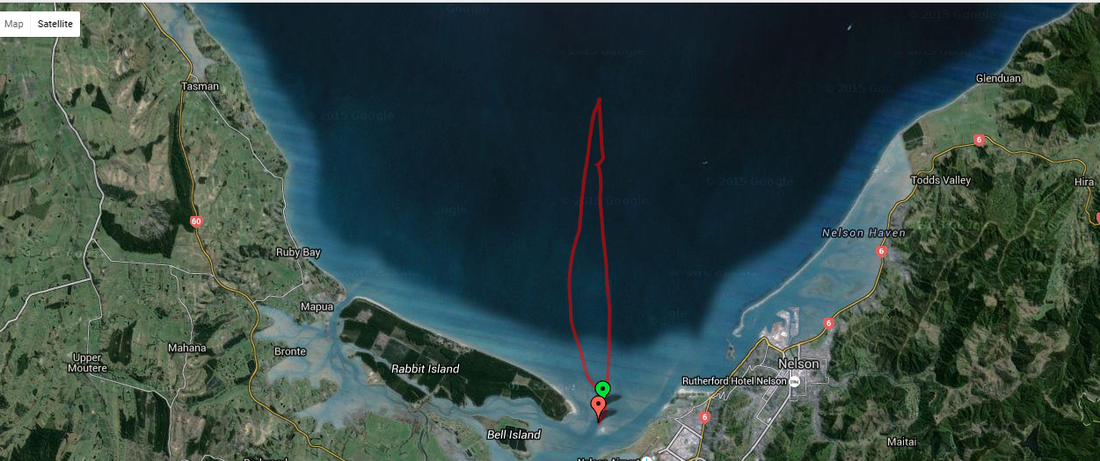
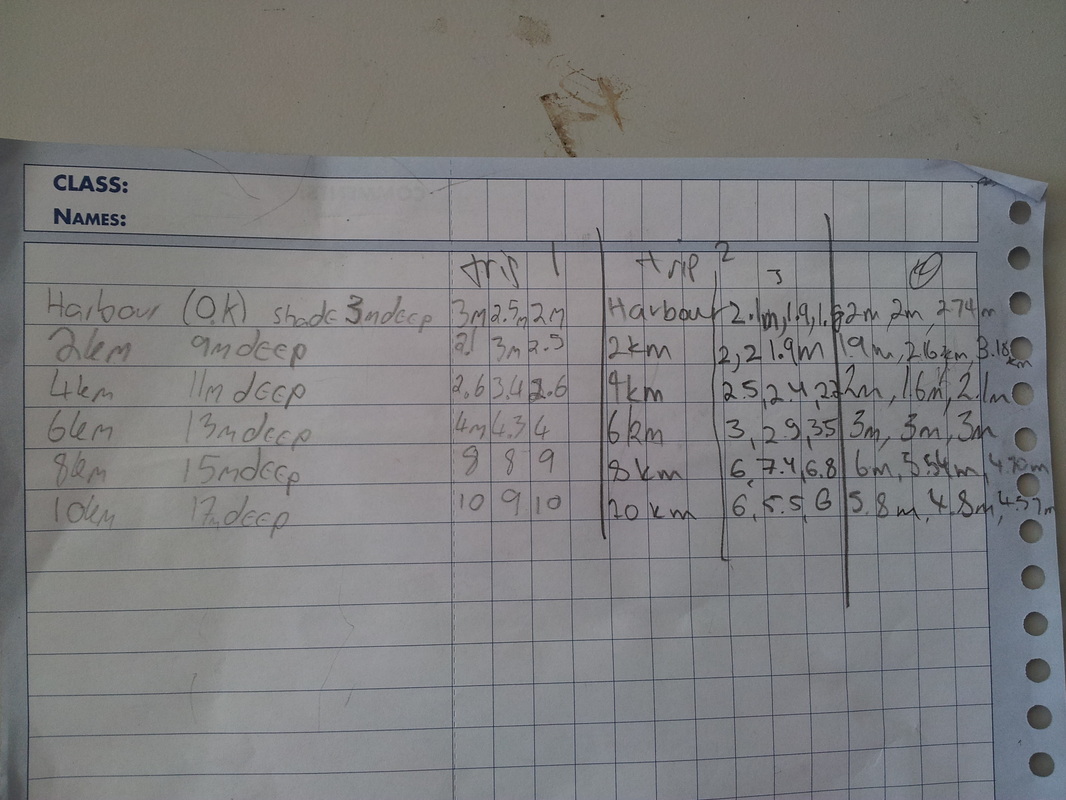
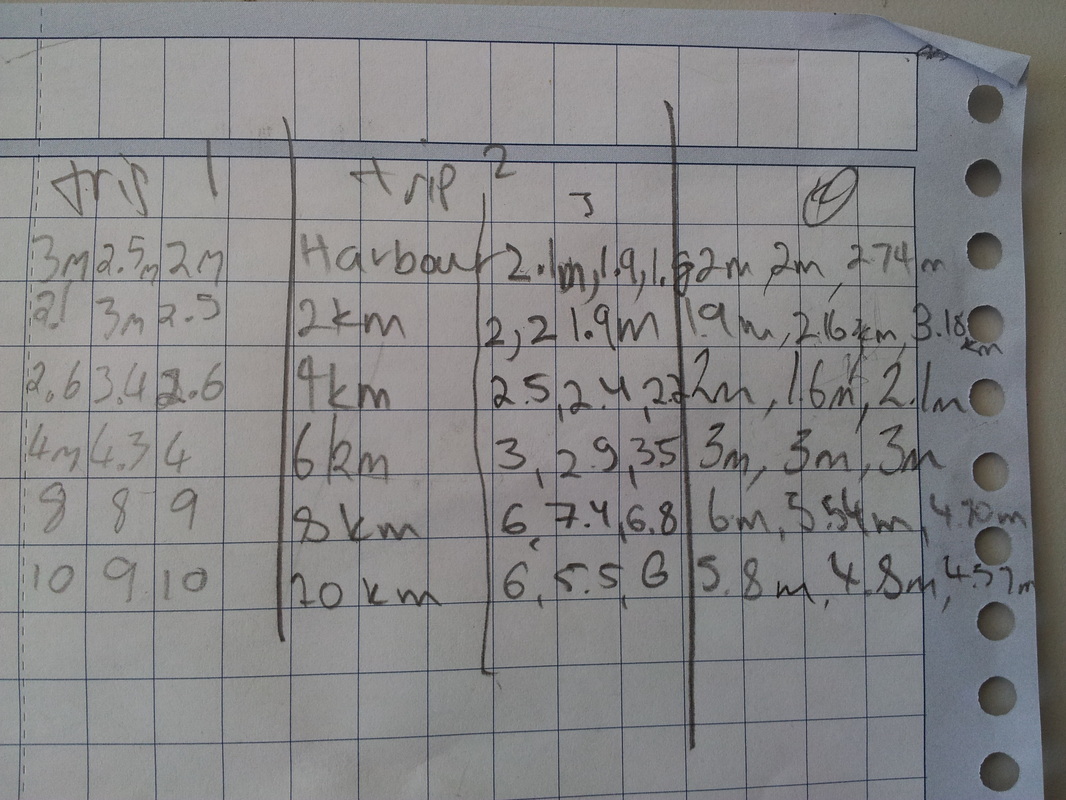
Google Earth...our trip track (or see pic below) The Secchi data we gathered You might want to enter that into a spreadsheet |
Some additional data avaivable from these two who got secchi depths in the harbour on March 11... ask them for the data, can you use it?
Here it is: (m)
0.9
0.9
0.9
0.9
0.9
also noted... v strong current flowing
Here it is: (m)
0.9
0.9
0.9
0.9
0.9
also noted... v strong current flowing
Some Historical Data
(you may include this in your discussion)
2015...
Justin and Seth got measurements in the Harbour
8/3/15.... 1 day after a major storm... so what?
93, 130, 135 98, 84 , 124 (all cm)
8/3/15.... 1 day after a major storm... so what?
93, 130, 135 98, 84 , 124 (all cm)
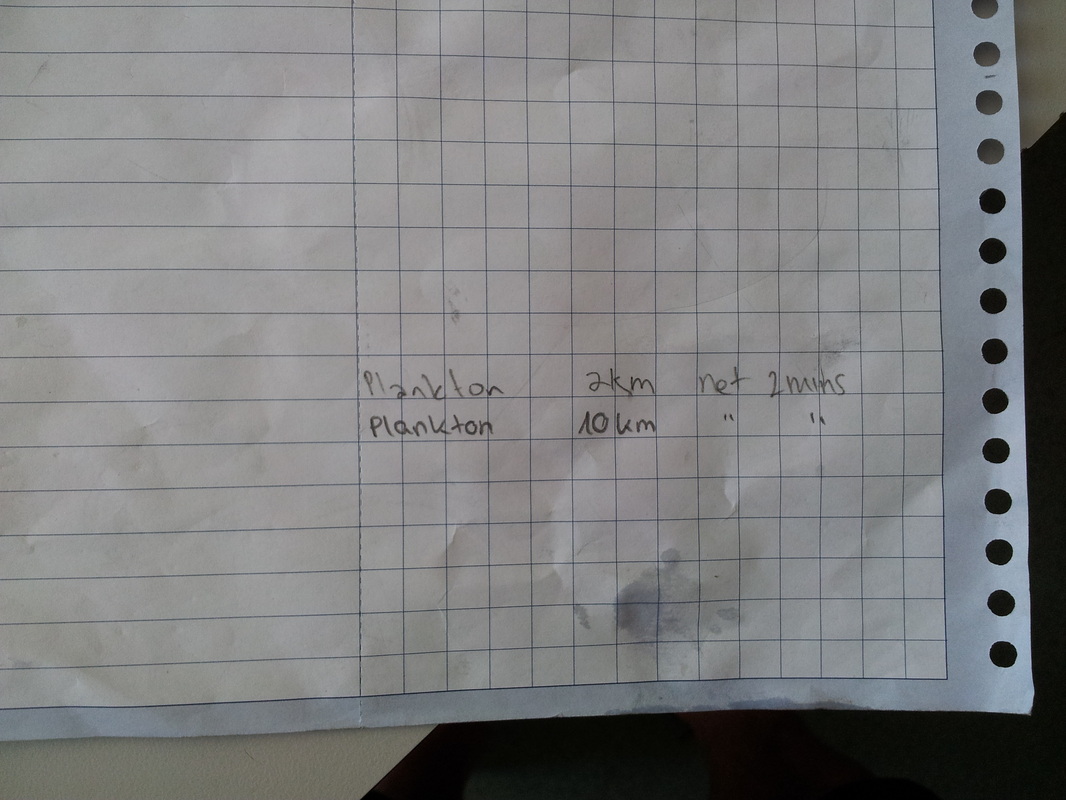
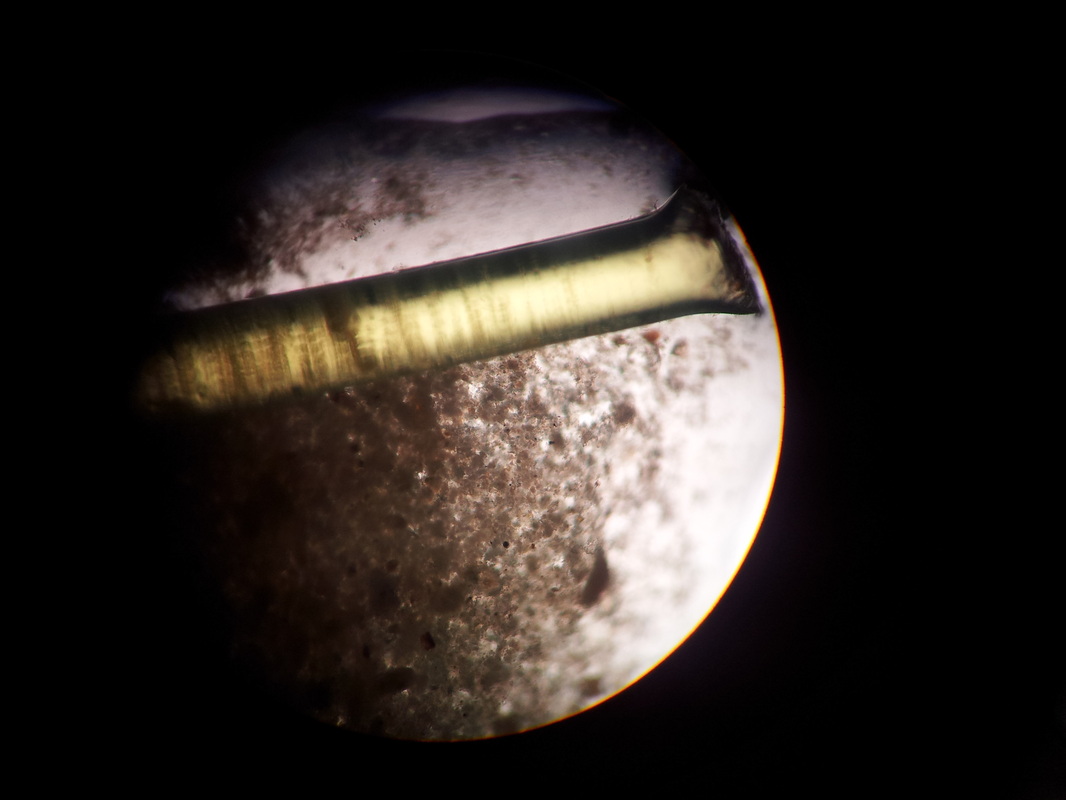
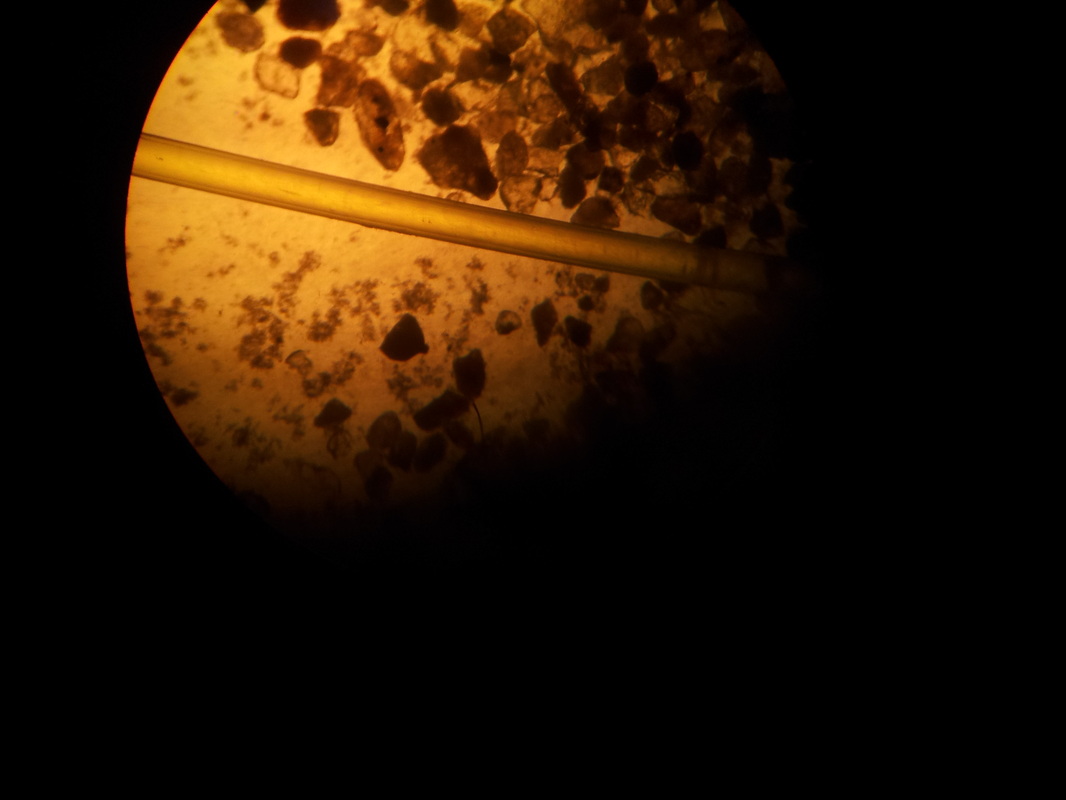
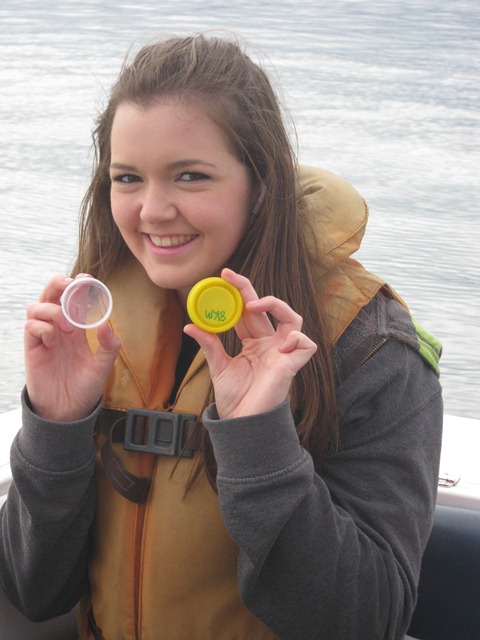
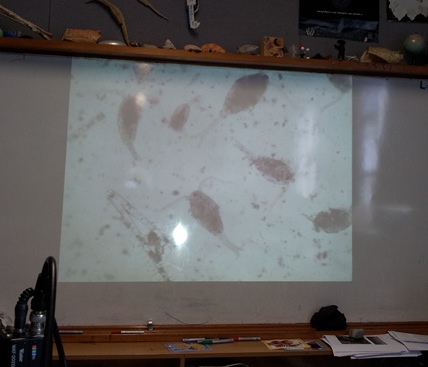
Plankton samples... (to think about: what are the TWO causes of increased turbidity?)
|
|
|
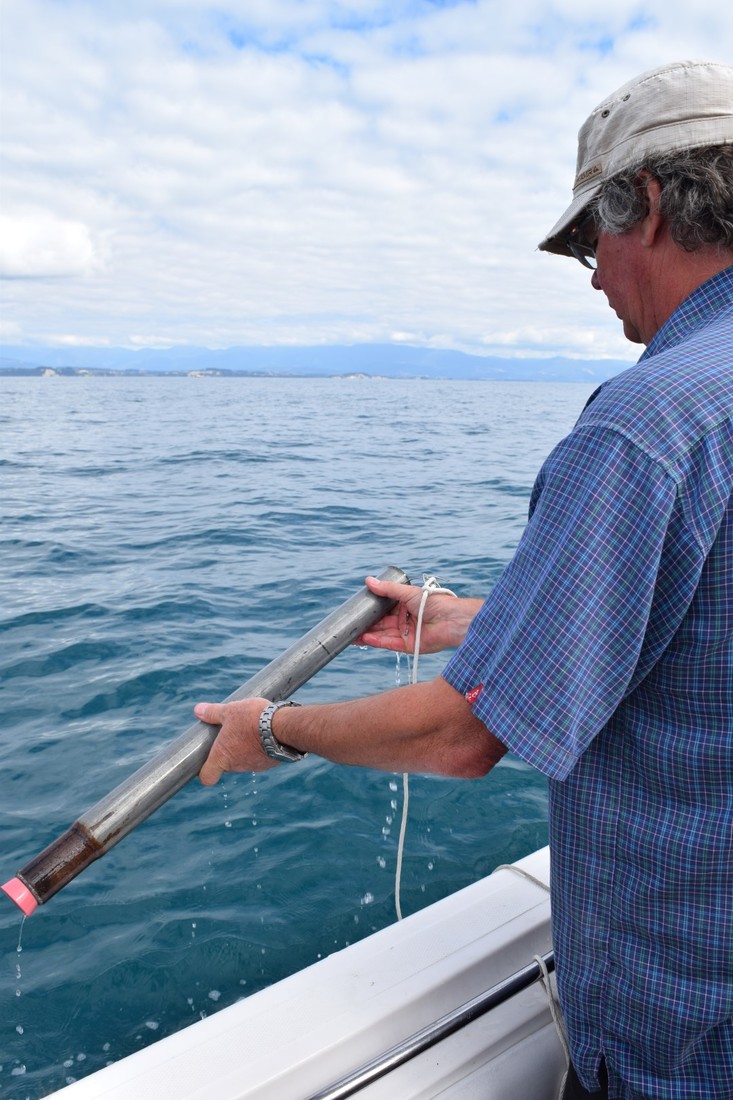
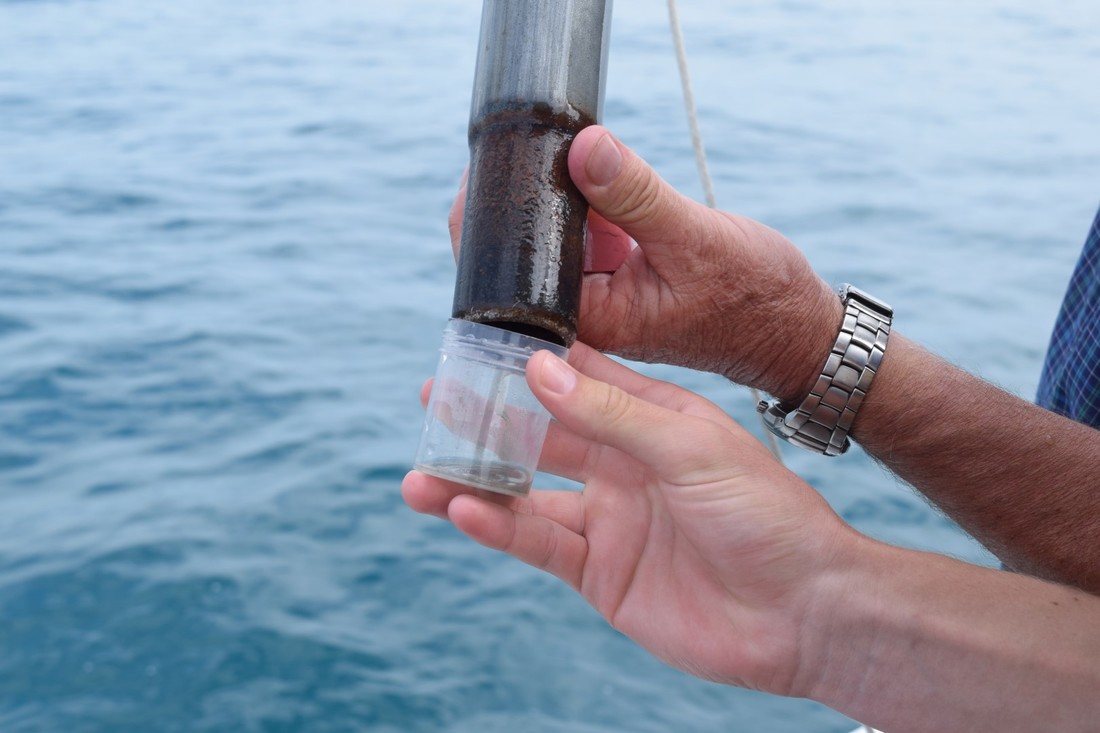
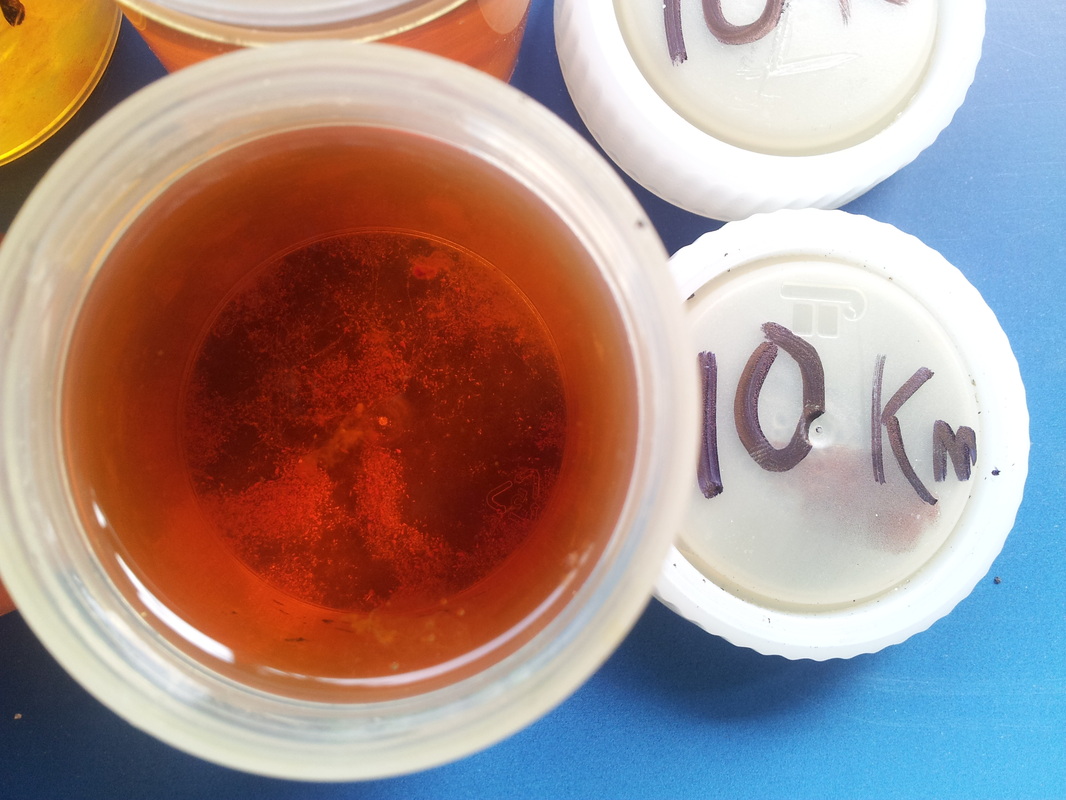
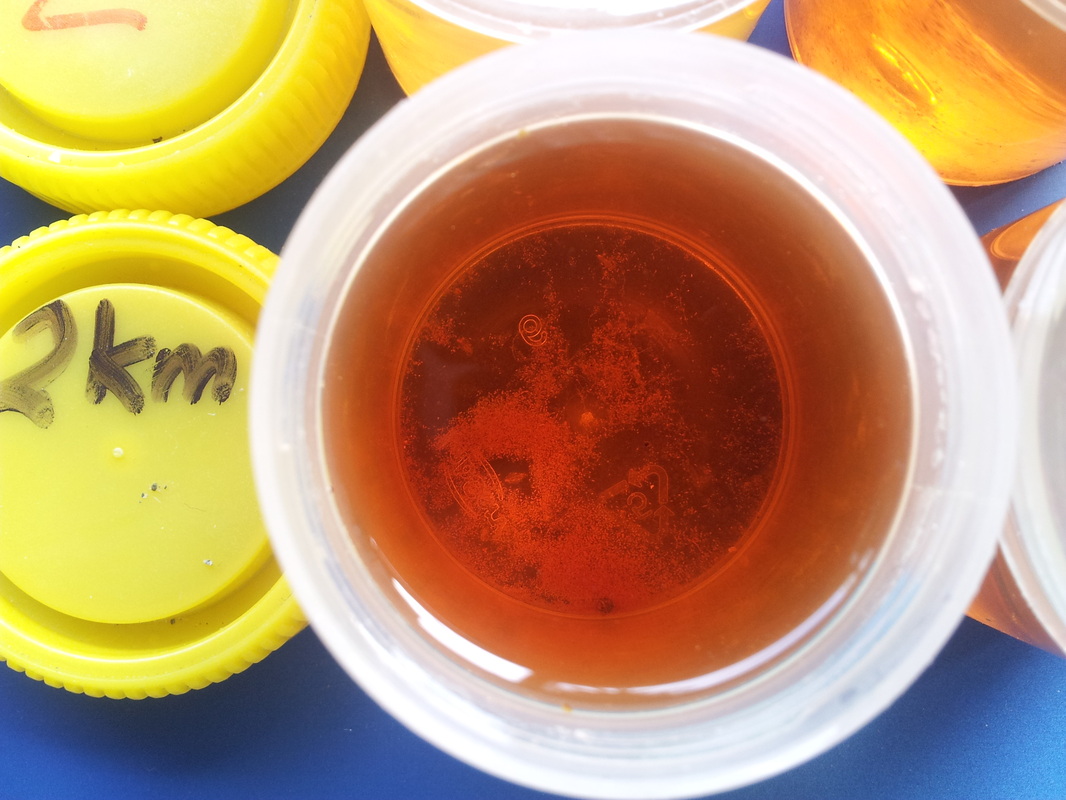
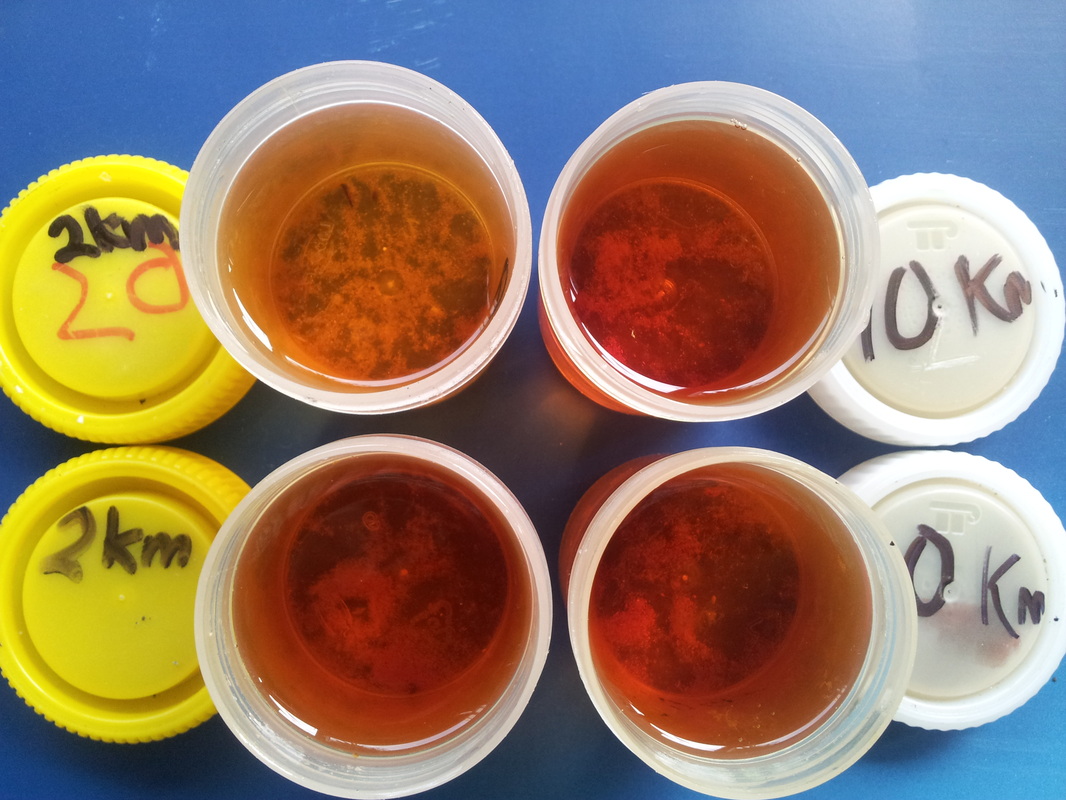
Sediment samples....
Nylon reference = 275 microns
Nylon reference = 275 microns
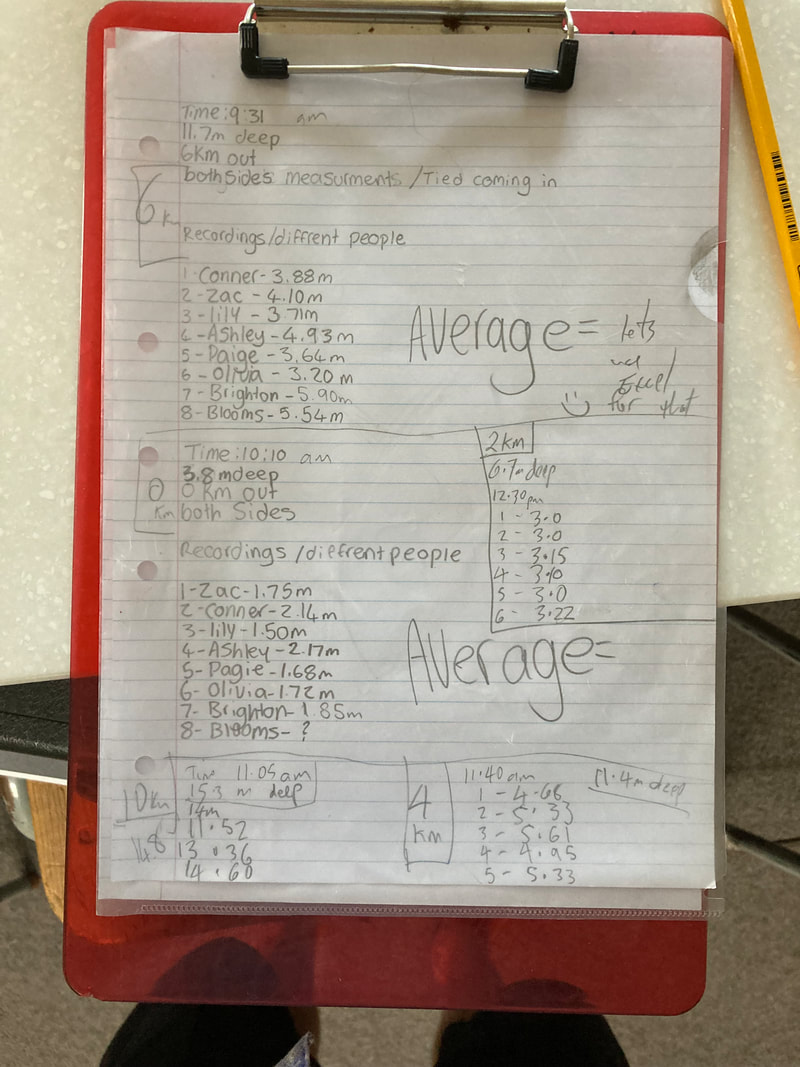
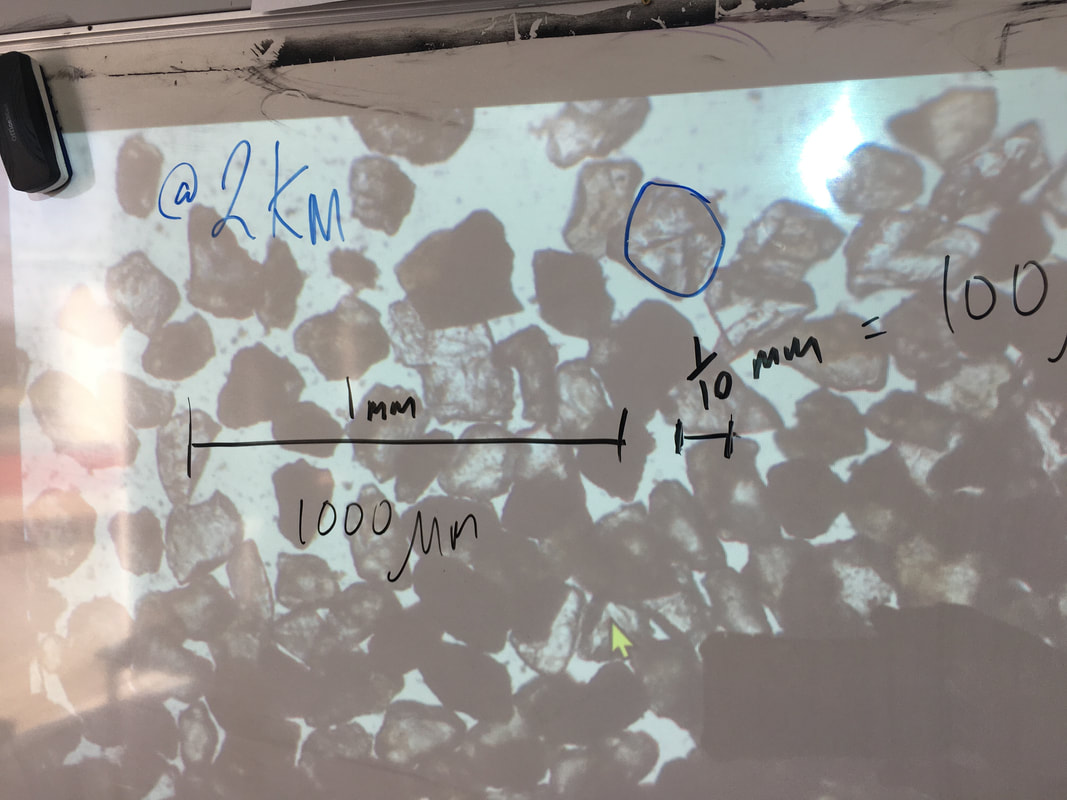
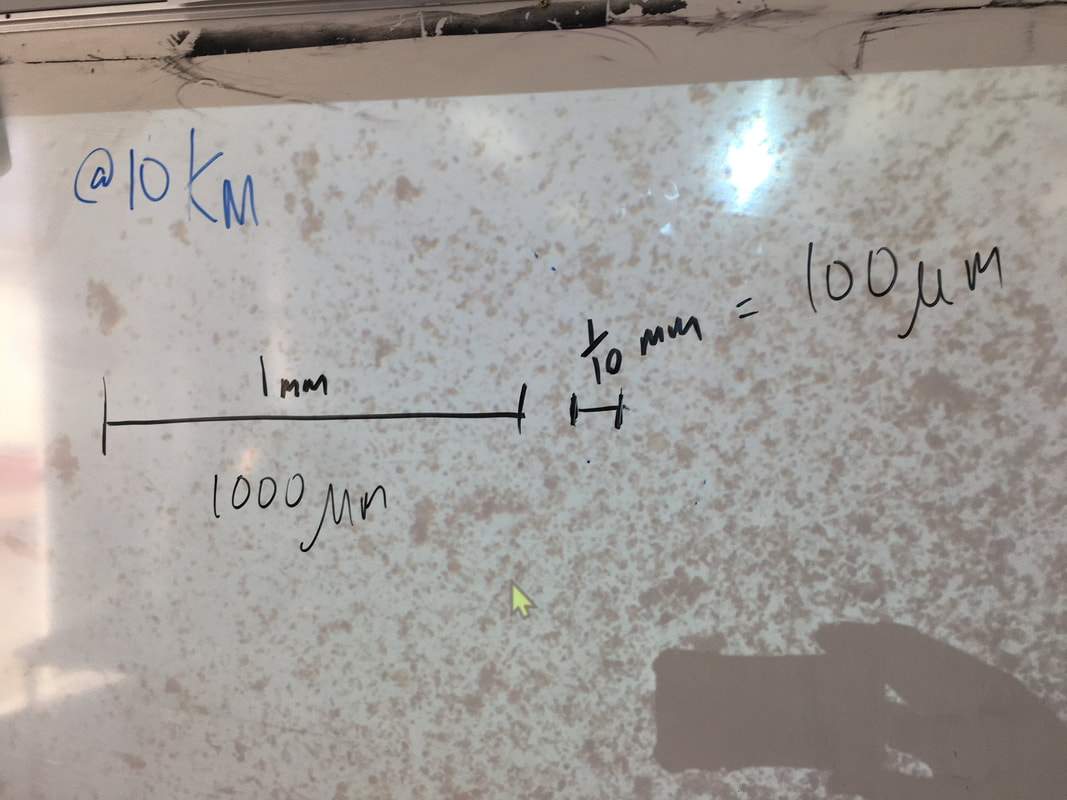
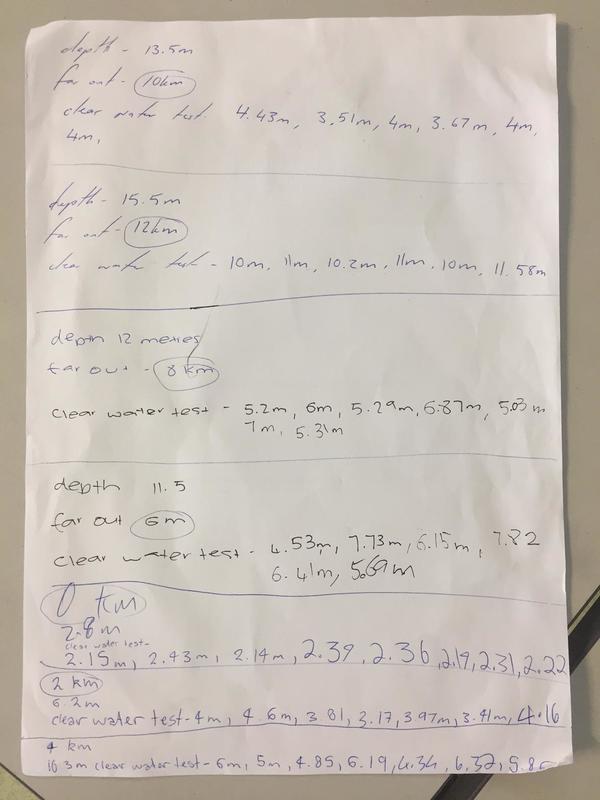
10 Km
|
2 Km
|
Trip up Barnicoat Feb 2015...
2013 trip.............
Crikey, we are famous !!!!! (thanks to Brianna & her clever phone)
Look (at this link) what i just found on a Plymouth University (UK) webpage
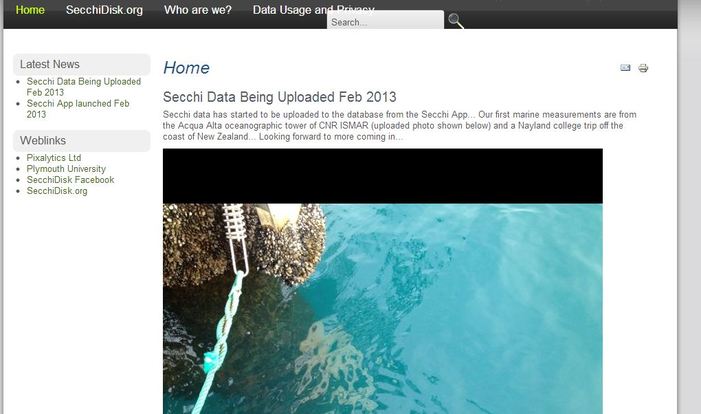
On this page are the pics from our trip, our raw data (download the xlsx file) and links to our other work on Tasman Bay as well as some student reports
| |||
Here we are doing lots of hard work
some of these images might find their way into your report?
These go: 2,4,6,8,10 & 12 Km..... notice any trend????
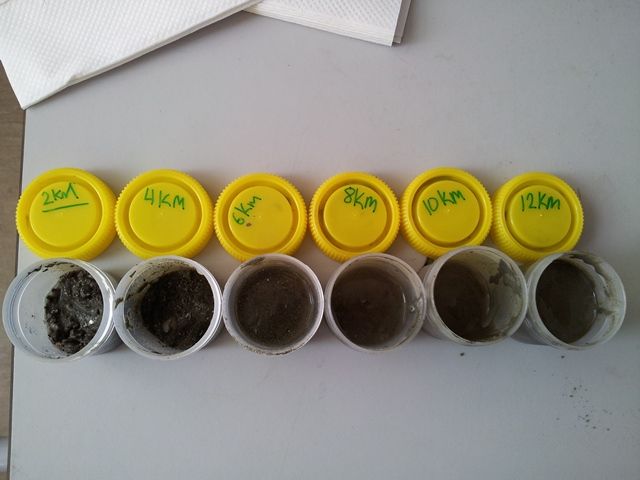
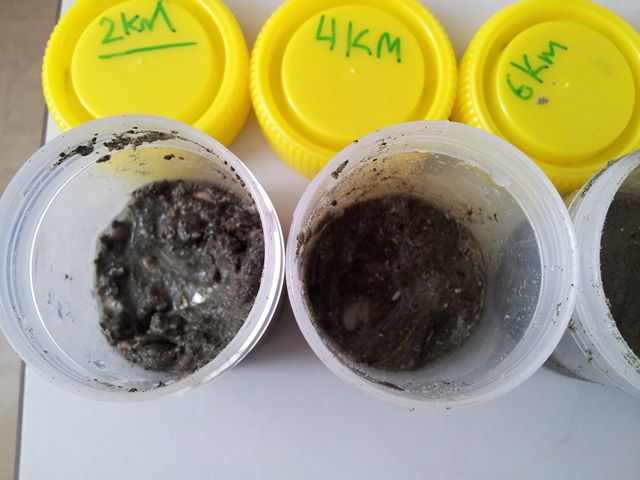
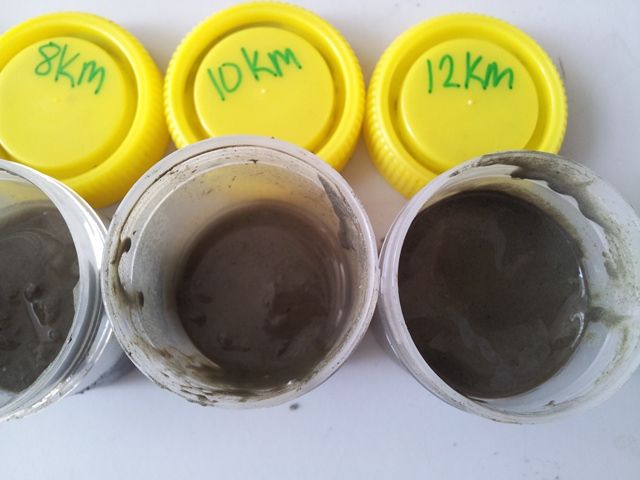
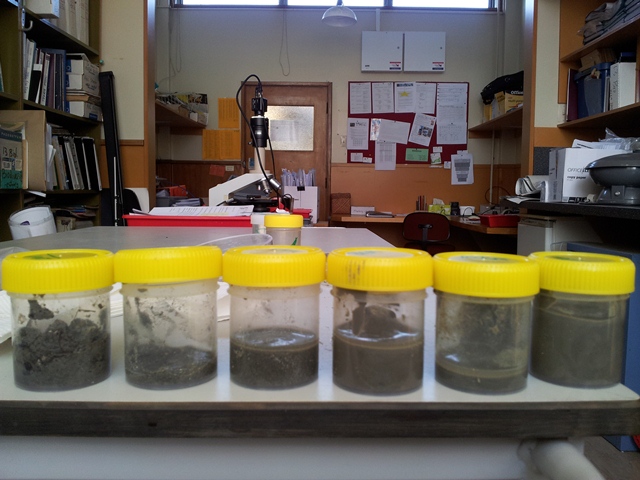
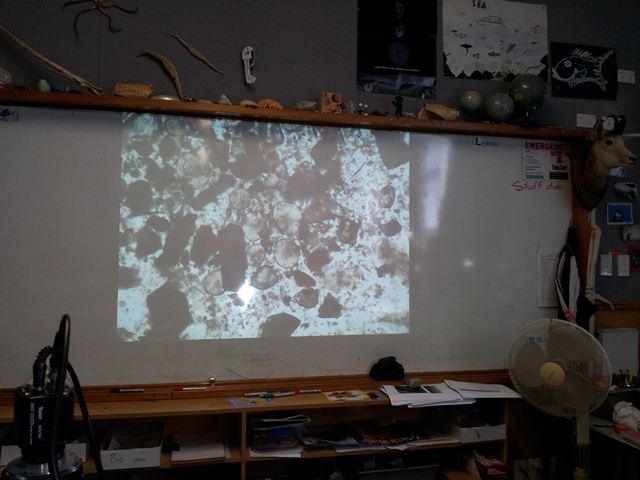
pics from our sediment sampling (via digital microscope).... (in order: 2Km, 4Km, 6Km & 12Km)
NB the grid is 1mm
NB the grid is 1mm
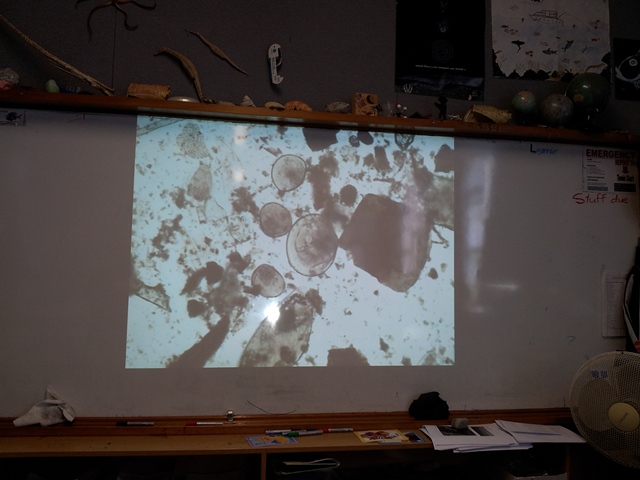
Also... samples from the plankton net (at the 4Km site)
via the video microscope and data projector
there really was a lot of plankton in the water!
via the video microscope and data projector
there really was a lot of plankton in the water!
